BLOG: Digital Financial Reporting
This is a blog for information relating to digital financial reporting. This blog is basically my "lab notebook" for experimenting and learning about XBRL-based digital financial reporting. This is my brain storming platform. This is where I think out loud (i.e. publicly) about digital financial reporting. This information is for innovators and early adopters who are ushering in a new era of accounting, reporting, auditing, and analysis in a digital environment.
Much of the information contained in this blog is synthasized, summarized, condensed, better organized and articulated in my book XBRL for Dummies and in the chapters of Intelligent XBRL-based Digital Financial Reporting. If you have any questions, feel free to contact me.
Entries from November 13, 2011 - November 19, 2011
Getting from Fact Table to Human Readable Rendering
This is the third installment of three blog posts which go together. The first to help you understand this third post. The first blog post helped you see that [Axis] articulate characteristics of a fact and that you can organize a set of facts into a fact table. The second blog post builds on the first, helping you to better see how fact tables work.
The final piece of this puzzle is turning that fact table into something useful to a human. This process is detailed in this document, From Fact Table to Rendering. Below I will summarize the key points (and I am not showing all the graphics, see the PDF for those).
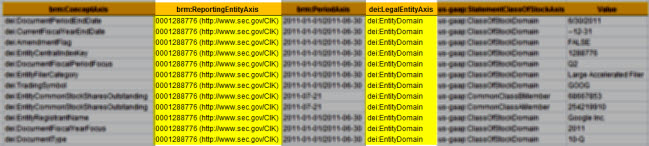
Step 1: Basic Fact Table. Here we have a basic fact table. (If you don't understand this, please go back and read the two blog posts which are pointed out above.)
The facts are in the rows. The [Axis] are in the columns. The Value is the value of the fact, the units show the units of the value if the value is numeric (most people don't consider this an [Axis], some do), and the rounding explains how many decimal places the fact has. For the purposes of this exercise we will ignore the units and rounding.

Step 2: Identify Slicers. A slicer is an [Axis] which has the same value or [Member] for each fact. For example, the ReportingEntityAxis and the LegalEntityAxis is the same for each fact. What we do with slicers is move them in the upper left hand corner (using my rendering model).
Step 3 Repositioned Slicers. In the PDF you can see the repositioned slicers. Basically, the slicers apply to each of the facts and they are the same for each fact. Slicers serve another role which is to filer facts, but we won't get into that here.
Step 4 Identify Columns. The next step is to identify the columns of the rendering. Different portions of a report have different conventions for rendering. You could render or present the information however you like. But conventions are good because they help software pick an appropriate option if options exist. So, we will follow the SEC interactive information viewer convention as it will meet our needs here. We look at the two [Axis] with the SEC put into the columns, the period [Axis] and the class of stock [Axis]. The colors show the different values or [Member]s for these [Axis].
Now, this would be a lot easier if there were only one [Axis] which went in the columns, but I wanted to show to so you can get an appreciation for how to think through this process. Also note that you have two concept [Axis] which are the same and have the same period; the only differentiator is the class of stock [Axis].
Step 5 Rendered Columns. Without trying to overdue the explanation, this is what the rendering of the columns look like (see the PDF) for the first iteration where each of the two [Axis] is placed in the column heading, and the values which have those characteristics are placed in those columns for the rendering.
Step 6 Organize the Rows. Next we order the rows. We could do that alphabetically, we could use the taxonomy presentation order, or we could frankly use whatever ordering you wanted; the easiest and what the SEC viewer uses is the taxonomy order.
Step 7 Tidy Things Up. And finally we tidy things up by pulling the "Document Information [Line Items]" concept from the taxonomy to hang the other concepts off of (providing organization), we grab the taxonomy labels because they are easier on the eye than those names, use whatever other colors we want, format to your heart's content.
Step 8 Leverage Information model. For some renderings understanding the information model helps you get the correct rendering. A good example of this is the roll forward. Different XBRL rendering engines leverage the information to a greater or lesser degree. The PDF shows a well rendered roll foward, and a Firefox add in rendering which is not that great. The SEC viewer understands how a user typically wants to view the roll forward information model and the Firefox add in does not, thus the funky rendering.
Most rendering engines get the roll up and hierarchy information model metapatterns correct, but not the roll forward or other information model metapatterns.
For more known metapatterns see: http://secxbrlglossary.wikispaces.com/Information+Model
So that is how we get to this:
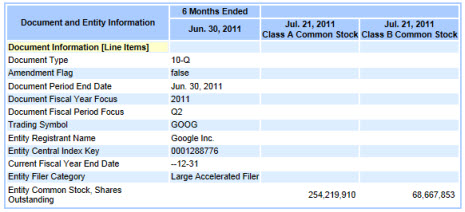
Not too bad.
A good question to ask yourself might be why can't the rendering within a creation tool look similar to this, basically allowing you to create or edit something like an SEC XBRL financial filing in a "what you see is what you get (WYSIWYG) style? I am NOT talking about editing HTML and then tagging that HTML with XBRL. I am talking about not even needing to "tag" anything. There is no tagging.
In a future post I will discuss semantic structured model-based authoring of financial statements and why you want that.
Business Report Tool Worth Checking Out
This business reporting toolis worth checking out. The tool is the APEX XBRL Maker 2011 and is created by Saltlake Infosolutions which says the tool is built to use the taxonomy created by Ministry of Corporate Affairs, Govt. of India.
I installed the application and installed some .Net 4.0 component I needed, and the application was up and running. The interface still needs polish. I entered some required information (probably about 10 things) and then generated the XBRL instance.
Frankly, I wish people would get away from the term "extended link" which is used by this application and use the proper semantic term "network" at a minimum, but even better something such as "section" which is far, far easier to relate to.
While this application does not appear to allow extension of the taxonomy, one can imagine that adding a row or a column to the existing interface would be workable for business users.
Certainly worth checking out.
If you hear of other good software applications or if you are a software vendor and have a good software tool and want people to be made aware of it, send me an email.
 Charlie
in Demonstrations of Using XBRL
|
Charlie
in Demonstrations of Using XBRL
|
 Post a Comment
|
Post a Comment
|  Email
|
Email
|  Print
Print
XBRL Syntax Editors Versus Semantic Modeling Tools
Today when you go to look at XBRL tools, what you find is XBRL technical syntax editors. This includes XBRL taxonomy creation software and XBRL instance creation software.
What is needed, in my view, is more along the lines of semantic modeling tools. Your typical business users will never be able to work with XBRL at the XBRL technical syntax level; nor should they want to and nor should they have to.
Clearly the first generation of software tools and applications needed to be low-level functionality which allows other developers to work at the XBRL technical syntax level. As software matures, business user applications such as applications used to create SEC XBRL financial filings and their supporting taxonomies will be more along the lines of semantic, structured modeling tools; not the XBRL syntax editors which we see today.
Charlie
in Creating SEC XBRL Financial Filings, Digital Financial Reporting
|
Post a Comment
| Email
| Print
IFRS Foundation Releases XBRL Formulas (Business Rules)
The IFRS Foundation released business rules in the form of XBRL Formulas for the IFRS taxonomy. I would expect that the US GAAP Taxonomy will not be far behind.
I have been a long time proponent of XBRL Formula to express business rules which XBRL calculations cannot express. The fact is, it is extremely unlikely that you can create a quality XBRL instance without using XBRL Formula or something like it to be sure the relations between facts reported are correct.
For instance, the IFRS Foundation classifies their XBRL Formulas into the following categories (see page 2 of this document):
- Cross period validations – whereas formulae will ensure that calculation of roll-forwards from beginning balance over the total changes over the period equals ending balance.
- Earnings per share validations– whereas formulae will ensure that the EPS calculation of the Profit (loss) and the average number of shares provides correct results.
- Axis aggregation validations – whereas formulae will ensure that members of an axis are calculated to their parent members properly (if applicable for a given axis and only if the filer structured their members in a summation-like hierarchy).
- Fact equivalence validations– whereas formulae will ensure that if two facts are tagged by different IFRS Taxonomy concepts but, conceptually represent the same thing, that they are equal. Usually, one of them is in a dimensional context, whilst the other one is not (e.g. ‘Aircraft’ = ‘Aircraft [member]’ in ‘Property, plant and equipment [axis]’ with primary item ‘Property, plant and
equipment’). - Common accounting equivalence validations – whereas formulae will ensure that general principles of accounting are applied correctly.
- Positive / negative fact validation – whereas formulae will ensure that if a fact is expected to be reported as an amount greater or equal zero it is not negative and vice versa.
- Percentage warnings– whereas formulae will ensure that the formal of percentage fact is appropriate according to the XBRL specification.
If you are not verifying these types of things to be sure they are correct, it is highly likely that they are not. Things may seem correct because you don't run the validation against your document. But if you do validate against business rules expressed using XBRL Formula, you might be surprised what you have missed.
Charlie
in Creating Investor Friendly SEC XBRL Filings, Modeling Business Information Using XBRL
|
Post a Comment
| Email
| Print
Building your Understanding of an [Axis], Characteristics of a Fact
In a previous blog postI explained that an [Axis] is "a means of providing information about the characteristics of a fact reported within a business report." Looking at a very simple area of an SEC XBRL financial filing helps to better understand how [Axis] work.
For a complete set of the SEC XBRL filings examined for this analysis, grab this Excel spreadsheet or this PDF. You can follow along using this PDF which walks you through the various scenarios discussed. It is hard to make each of these images fit in the narrow blog page.
So, let us consider the document and entity information of an SEC XBRL filing which is relatively consistent.
Scenario A: Basic document information: Here you see the basic [Axis] used by many filers when reporting document and entity information.
All of the other scenarios build on this base case scenario where a filer is reporting document and entity information. Again, visual images are provided in this PDF which are helpful in understanding the different scenarios.
Scenario B: Legal Entity [Axis] is Explicit: This filer explicitly adds the axis "dei:LegalEntityAxis" to the document and entity information [Table] (as compared to the scenario above where the filer did not even create a [Table], using only the concept, reporting entity, and period [Axis]). This raises the question, why are these two SEC XBRL filings using different [Axis] on what amounts to basically the same information?
Edgar Filer Manual Section: The EFM states in essence that if you do not explicitly provide a "dei:LegalEntityAxis" it is assumed or implied that all information reported relates to the "consolidated entity" (which is represented in the US GAAP taxonomy by the member "dei:EntityDomain". Personally I believe that being explicit is better, particularly now with XBRL viewer and analysis software not being very mature. Further, generic off-the-shelf XBRL software does not understand what the SEC is or is not implying.
Scenario C: Legal Entity [Axis] is Implied: So in essence, even if the an SEC filer does not explicitly provide the dei:LegalEntityAxis with the value of dei:EntityDomain, which represents to consolidated entity; it can be implied that the information relates to the consolidated entity. This scenario repeats scenario A, just showing that the legal entity, although it is not physically there, semantically it actualy does exist.
Scenario D: Legal Entity [Axis] is Explicit, Class of Stock [Axis] Explicit: This SEC filer makes both the legal entity explicit, and also provides a class of stock [Axis].
Edgar Filer Manual Section: The EFM states in essence that if you do not specify which class of stock a fact relates to, then it is implied that the fact relates to all classes of stock; basically implying a class of stock [Axis]. This seems to be consistent with how the legal entity axis works.
Scenario E: Legal Entity [Axis] is Implicit, Class of Stock [Axis] Implicit: This SEC filer provides neither a legal entity nor a class of stock [Axis]; however, because of the SEC rules both these [Axis] can be implied.
Scenario F: Legal Entity [Axis] is Implicit, Class of Stock [Axis] Implicit; Scenario [Axis] is explicit: This SEC filer provides neither a legal entity nor a class of stock [Axis]; however, because of the SEC rules both these [Axis] can be implied. This filer does, however, provide a scenario [Axis] explicitly.
Edgar Filer Manual Section: It seems to be the case that if no scenario [Axis] is provided, that the scenario us-gaap:ScenarioUnspecifiedDomain is implied per the EFM.
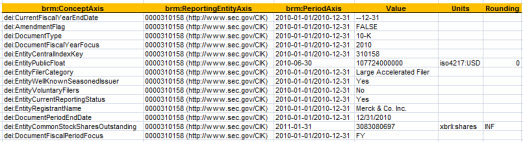
Scenario G: Document information and entity information in separate [Network]s: The majority of filers report document and entity information within the same network. Yet here, two filers report document information in one network and entity information in a different network. From a business semantics perspective, as can be seen from the [Axis] of the facts; which network is used makes no difference in the characteristics of the information.
Scenario H: Does the Entity Registered Name, Document Type, or Document Fiscal Year Focus Really have a Class of Stock?: The [Member] or value of an [Axis] articulates a characteristic of a fact. An [Axis] relates to an entire fact table. Does it really make sense that concepts such as entity registered name, amendment flag, document type, and document fiscal year focus to have a class of stock [Axis]? Or, would it make better sense to model facts which share characteristics in on [Table] and other facts with different characteristics in a different [Table]?
The Bottom Line:
Does cash and cash equivalents, receivables, payables, long term debt, or other such balance sheet line items have a class of stock? If you model a balance sheet with a class of stock [Axis] that is precisely what you are articulating. What does have a class of stock is preferred and common stock, not the entire balance sheet.
This is just like property, plant, and equipment or debt or some other detailed disclosure being modeled with an [Axis] differentiating the classes of that line item; but the balance sheet itself does not have that [Axis], only the disclosure does.
The document and entity information is pretty basic, but thinking about the characteristics which are associated with these basic facts can help you grapple with other more complex areas of an SEC XBRL financial filing. Think about the semantics of what you are communicating.

