BLOG: Digital Financial Reporting
This is a blog for information relating to digital financial reporting. This blog is basically my "lab notebook" for experimenting and learning about XBRL-based digital financial reporting. This is my brain storming platform. This is where I think out loud (i.e. publicly) about digital financial reporting. This information is for innovators and early adopters who are ushering in a new era of accounting, reporting, auditing, and analysis in a digital environment.
Much of the information contained in this blog is synthasized, summarized, condensed, better organized and articulated in my book XBRL for Dummies and in the chapters of Intelligent XBRL-based Digital Financial Reporting. If you have any questions, feel free to contact me.
Entries from January 7, 2018 - January 13, 2018
Further Updated and Expanded XBRL-based Financial Report Extraction Tools
I have further updated, expanded, and tuned the XBRL-based financial report extraction tools that I posted last week. Here are the improvements:
- 3,865 financial reports of public companies (about 65% of the total) all of which pass 100% of the fundamental accounting concept validation cross checks. (The prior version had 3,015 companies or about 50%)
- Synchronized all the validation rules to the commercially available versions provided (99.9% consistent)
- Changed the "IF...THEN" rules which were hard to edit/maintain to immediate IF functions per the suggestion of some. This was REALLY helpful. This change makes maintenance significantly easier.
- Nine reporting styles are provided for. (Prior version only had four)
I really cannot overstate the usefulness of these Excel spreadsheets. What I have stumpbled across is the fact that the same business rules that I use to validate an XBRL-based financial report can be used to extract information from reports. Today, each data aggregator that extracts information from reports had to create their own set of algorithms and rules for doing so.
Here are the revised versions: (This video will help you understand how to use the tool)
- COMID-BSC-CF1-ISM-IEMIB-OILY-SPEC6: 1,642 public companies
- COMID-BSC-CF1-ISS-IEMIB-OILY-SPEC1: 714 public companies
- COMID-BSC-CF1-ISS-IEMIB-OILY-SPEC2: 653 public companies
- INTBX-BSU-CF1-ISS-IEMIX-OILN: 416 public companies
- COMID-BSC-CF1-ISM-IEMIB-OILY-SPEC9: 143 public companies
- COMID-BSC-CF1-IS3-IEMIB-OILN: 83 public companies
- INSBX-BSU-CF1-ISS-IEMIX-OILN: 94 public companies
- COMID-BSC-CF1-IS6-IEMIX-OILN: 79 public companies
- COMID-BSC-CF1-IS4-IEMIB-OILN: 41 public companies
- Total provided: 3,865 public companies (65% of all public companies)
- COMID-BSC-CF1-ISS-IEMIT-OILY-SPEC2: 38 public companies
- COMID-BSC-CF1-ISM-IEMIB-OILY-SPEC6-SCI2: 37 public companies
- COMID-BSC-CF1-ISS-IEMIB-OILY-SPEC2A: 64 public companies
- COMID-BSC-CF1-IS8-IEMIB-OILN: 56 public companies
- Net total provided: 4,060 public companies (68% of all public companies)
Comparisons by period for: (one ZIP file containing 9 Excel files, about 1 MEG)
Download all: (each reporting style above and all comparisons, about 3.1 MEG)
Here are a few tips for using the examples:
- All the spreadsheets come pre-populated. But, you can re-run the extraction routine and populate the spreadsheet by pressing the button on the "Compare" sheet.
- The "List" sheet is where the list of XBRL-based financial reports from which information will be extracted and validated.
- If you put an empty row in the "List" spreadsheet, the extraction/validation will stop when it hits that row.
- If you want to validate a local file, simply put the local path to the file or files in the "List" spreadsheet.
 Charlie
in Becoming an XBRL Master Craftsman
|
Charlie
in Becoming an XBRL Master Craftsman
|
 Post a Comment
|
Post a Comment
|  Email
|
Email
|  Print
Print
AsReported XBRL-based Public Company Financial Report Quality Measurement
AsReported has provided a set of measurements related to the quality of XBRL-based financial reports created by different software vendors and filing agents. Here is their blog post that has the measurements.
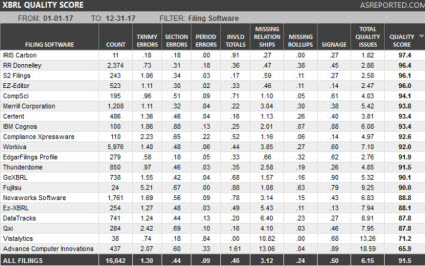
What AsReported is measuring is a bit different than what I am measuring. My focus is on accounting and reporting logic. AsReported is more focused on mechanical, structural, mathematical, and some logical relations at this point it seems. What is interesting is that they give each filing agent/software vendor a score (see the right most column). They call this the "Quality Score" and discuss that metric on their blog.
Another software vendor taking measurements is XBRL Cloud. They provide details for each filing on their EDGAR Dashboard. You can search by company name and get details by public company. Here is an example.
Charlie
in Creating Investor Friendly SEC XBRL Filings
|
Post a Comment
| Email
| Print
Updated and Expanded XBRL-based Financial Report Extraction Tools
I have updated Excel tool and expanded the set of reporting styles covered by the tool which extracts information from XBRL-based financial reports submitted to the SEC. The set of tools below covers 50% of all public companies that file with the SEC. The tool accurately extracts fundamental high-level financial information from the 3,015 covered economic entities.
So in my commercially available metadata set, my coverage is higher, 90% or more which is explained here in this document. But only about 87.9% report all of their high-level financial information correctly.
In this set of 3,015 public company financial reports, all the information is consistent with expectation and FOUR different report styles are covered. So the proof is in the pudding here. If you REALLY want to understand what it takes to get these reports correct and to extract information from the reports correctly; these Excel tools will help you understand that:
- SPEC6: 1,445 public companies (this is by far the most popular reporting style)
- SPEC1: 629 public companies
- SPEC2: 566 public companies
- INTBX: 375 public companies
- Total 3,015 (See page 6 of this document for more detailed information about reporting styles; see this web page to understand the details of a reporting style)
This step-by-step explanation helps you understand how the Excel extraction tool works. Note that while I am showing the extraction of primary financial report information, this same scheme applies to the disclosures also. And, while this Excel extraction tool only pulls information for the current reporting period, this same scheme can be used to get prior period information in a report also.
Each Excel spreadsheet has the information preloaded. But if you press the button on the "Compare" spreadsheet, the application will re-extract information directly from the public company's XBRL-based financial report.
My goal is to provide similar spreadsheets for a handful of other reporting styles and to synchronize the business rules in this application 100% with the commercial quality tool metadata used by XBRL Cloud and Pesseract. So, I already solved one of the two problems I am having. The commercial tools use declariative business rules that are provided via the XBRL technical syntax. You will note that my business rules (mappings, impute rules, consistency check rules) are hard-coded. That is not good. But, because I am not a very good programmer, that is the best that I can do. But, what I was able to achieve is to generate the VBA code from reading the XBRL-based information. For example, here are the mapping rules for the SPEC6 reporting style. I am not auto-generating the VBA code for the mapping rules from those XBRL definition relations.
I am also going to reorganize the XBRL files that provide this information. I have a lot of unnecessary duplication right now. That duplication resulted from the fact that I really did not know exactly how this process of creating the metadata would turn out when I started. I know now, so I am going to refactor the way I physically represent the information so that it is easier to debug and maintain.
One very important thing that I am observing is the difference between a "top down" and "bottom up" approachto creating XBRL-based taxonomies. I am still trying to figure out exactly how to articulate this. I don't know that "top down" and "bottom up" are the right terms. Other terms are "publisher focus" as contrast to "consumption focus". Another term is "restrict then loosen" as contrast to a "slack then restrict".
If you understand the principles at workwhen you take an existing reporting scheme and decide how you will make that work using XBRL, there are lots of things that need to be considered. Theoretically, the best way to implement is to create a restrictive as possible model; then incrementally loosen what is allowed to allow more within the system. That keeps everything in control. Alternatively, the approach where you provide a very loose model; but then you incrementally restrict the model to make it tighter and tighter looks very "sloppy" because you initially get a lot of errors.
While I am noticing that I am doing 80% (maybe more) additional work having to overcome things that were not included, but should have been included, with XBRL-based financial reporting; I really cannot see any other way to make this work other than how the SEC is approaching it. The "loose model" that the SEC started with was smart. Why? Because if a restrictive as possible model was used initially, public companies would likely have rioted.
Those incremental restrictions are emerging slowly but surely. Things like my fundamental accounting concept relations continuity cross checks, the disclosure mechanics rules, the reporting checklist rules, the XBRL US Data Quality Committee rules, etc.; those are incremental restrictions what will improve information quality and therefore make the information more useful.
Charlie
in Becoming an XBRL Master Craftsman
|
Post a Comment
| Email
| Print

