BLOG: Digital Financial Reporting
This is a blog for information relating to digital financial reporting. This blog is basically my "lab notebook" for experimenting and learning about XBRL-based digital financial reporting. This is my brain storming platform. This is where I think out loud (i.e. publicly) about digital financial reporting. This information is for innovators and early adopters who are ushering in a new era of accounting, reporting, auditing, and analysis in a digital environment.
Much of the information contained in this blog is synthasized, summarized, condensed, better organized and articulated in my book XBRL for Dummies and in the chapters of Intelligent XBRL-based Digital Financial Reporting. If you have any questions, feel free to contact me.
Forbes: Impact of Artificial Intelligence on Professional Services
A Forbes article, The Impact Of Artificial Intelligence On Professional Services, points out that accountants and lawyers are using artificial intelligence to cannibalize their own businesses...before someone else does. The article points out:
The firms that prosper will be the ones that grab the opportunity first to re-skill their technology and their people. The future is not about number-crunching transactions, but about judgement and wisdom.
And it says:
Automation is about removing friction, driving down costs, speeding processes up, and generally improving efficiency. Making goods and services better and cheaper is a good thing: it makes us all richer.
The article discusses what EngineB, the Big 4, several of the next tier and challenger firms, the Institute of Chartered Accountants in England and Wales (ICAEW), and Microsoft are doing to improve efficiency.
EngineB is not the only one automating processes. ContractZ.app, Logical Contracts, and likely others are all over this opportunity. People are thinking about using distributed ledgers for audits. AI assisted audits are here.
 Charlie
in Digital Financial Reporting
|
Charlie
in Digital Financial Reporting
|
 Post a Comment
|
Post a Comment
|  Email
|
Email
|  Print
Print
Proof Business Use Case Represented in Six Technical Syntax
The OMG's forthcoming Standard Business Report Model (SBRM) is a logical conceptualization of a business report. XBRL International's Extensible Business Report Language (XBRL) is one technical syntax that can be used to represent a business report in machine-readable form. There are other machine-readable formats.
My "Proof" test case or business use case exercises 100% of what you would ever find in an XBRL-based digital financial report. Believe it or not, it is true. The Proof representation was specifically designed for that purpose; to exercise SBRM in order to make sure it met the needs of financial reporting. I have many other test cases/use cases.
I have now been able to represent 100% of the financial report logic found in the Proof representation using six different technical syntax (seven if you view raw XBRL and Inline XBRL as different technical syntax). You can download each one and have a look at it from here:
- XBRL: This representation includes raw XBRL and Inline XBRL. Other functionality can be performed such as validation and rendering using standard off-the-shelf software that supports the global standard XBRL. To understand all that, see this web page.
- Microsoft Access (i.e. SQL): The XBRL, Excel, and CSV representations all came from this Microsoft Access database application. You can download the version with the code that outputs XBRL here.
- Excel: This Excel version is simply an Excel spreadsheet for each database table.
- CSV: This CSV version is simply the Excel spreadsheet saved as CSV from Excel.
- RDF/OWL/SHACL: (Work in progress) This is being created by the team creating SBRM; the Proof version has not yet been created, this is a representation of the Accounting Equation that is partially complete for the time being.
- PROLOG: (Work in progress) This is being created by a PROLOG expert and will be completed over the next several months. Currently, a PROLOG version is provided for the SFAC 6 example which does not include a couple of mathematical relations that the Proof representation includes, but it will give you a very good idea that the Proof example can be represented using PROLOG.
What does this mean? First, no matter what technical syntax is used; 100% of the business logic of the use case must be able to be represented vial that technical syntax. This pretty much proves that any of the syntax alternatives above could be used to represent a business report in machine-readable form. You can choose which technical syntax you prefer to work with; but you cannot simply leave information out. Second, if you can get information into any one of these technical syntax you can convert the logical representation into any other technical syntax.
Which technical syntax is best? Well, that is up to you. Pick whatever technical syntax you like from above. Create another technical syntax. Each alternative has a specific set of pros and cons.
Charlie
in Digital Financial Reporting
|
Post a Comment
| Email
| Print
SME Accounting Software
Small business accounting software is very competitive. The Best Small-Business Accounting Software of 2020 provides a comparison of the most popular accounting software. This provides a list of the 19 accounting software applications loved by small business. Recently I have tried the following:
Here is my impression of what I have seen. First, not one of these accounting software applications really helps with cost accounting and other important functionality small businesses really should be using. To be honest, it has been my experience during my 35 years as a CPA that very few businesses actually properly analyze the information generated from their accounting system. For example, most business owners don't have a very good handle on their fixed costs as contrast to their variable costs. They cannot really have a good conversation about contribution margin or break even point.
Second, not one of the accounting software applications allows you to generate what I would consider a proper set of financial statements. They tend to not differentiate between "current" and "noncurrent" on the balance sheet or "operating" and "nonoperating" on the income statement. None really provides a decent cash flow statement (Wave does the best job).
Perhaps my expectations are too high. Perhaps I am used to working with larger organizations that are more sophisticated in terms of their accounting function. If these small businesses are happy, which they seem to be because millions use these sorts of software applications, good for them. I am just making an observation.
What is incredibly good about all of those software applications is that they appear to be entire ecosystems that incorporate an increasing amount of functionality for small businesses. The down side is that you are locked into their ecosystem; you cannot really pick and choose. Reminds me somewhat of Comcast, Roku, Apple TV, and Fire set top boxes.
Imagine a robust ecosystem like QuickBooks that incorporated augmented intelligence functionality that helped the software users perform more sophisticated financial analysis. Key to that financial analysis is having the underlying information right.
Something really interesting is that Wave was purchased by H&R Block for $405 million. Wonder what that is all about. Is H&R Block expanding into the bookkeeping business?
Seems like a middle market accounting software ecosystem would be a good thing. Twenty years ago my favorite accounting software was Great Plains Dynamics 3.0 which had a Microsoft SQL database. I was very, very happy with that software. Microsoft purchased Dynamics (and many other accounting software vendors).
My current favorite is Acumatica. Acumatica also has a Microsoft SQL database (there are others), the UI is HTML 5, you can modify the application using Microsoft.Net, and the interface is very clean and well-thought-out. Acumatica was built to be cloud computing based from the beginning.
What would be incredible is some sort of open source ecosystem that is not tied to any one specific software vendor that tried to control everything. For example, imagine an iPhone application ecosystem that is not controlled by Apple. I wonder how the Android ecosystem works. Who is in charge of it? You can get Android apps from the Google app store. Samsung has an app store for Android apps. There seems to be other Android app stores. Android seems to be controlled by Google but open source. Not sure if an ecosystem that is not controlled by some software vendor would work. Maybe, maybe not. Maybe a consortium of companies or a coop. Be good to reduce the "friction" that exists. Seems that would benefit everyone.
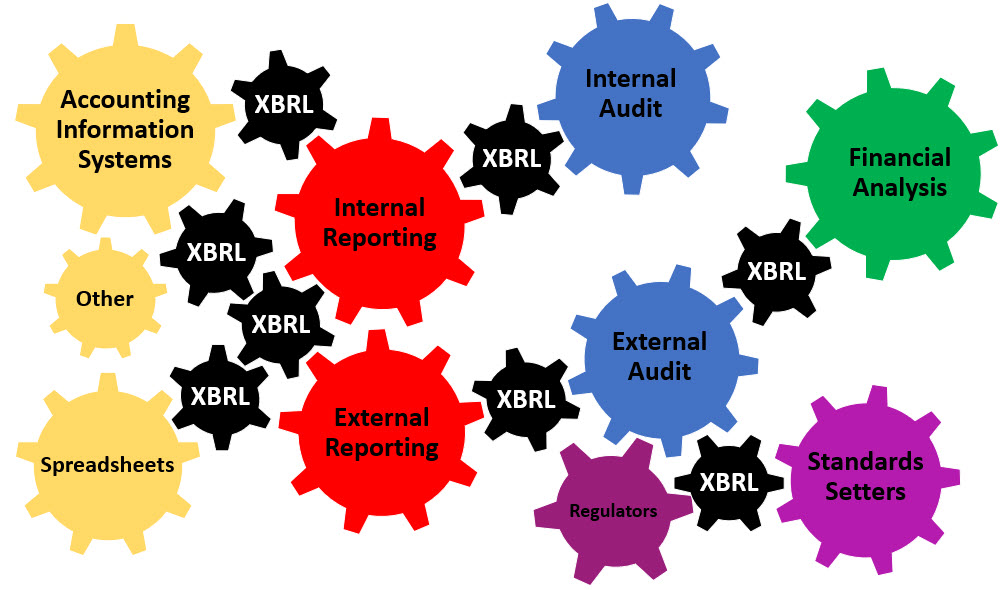
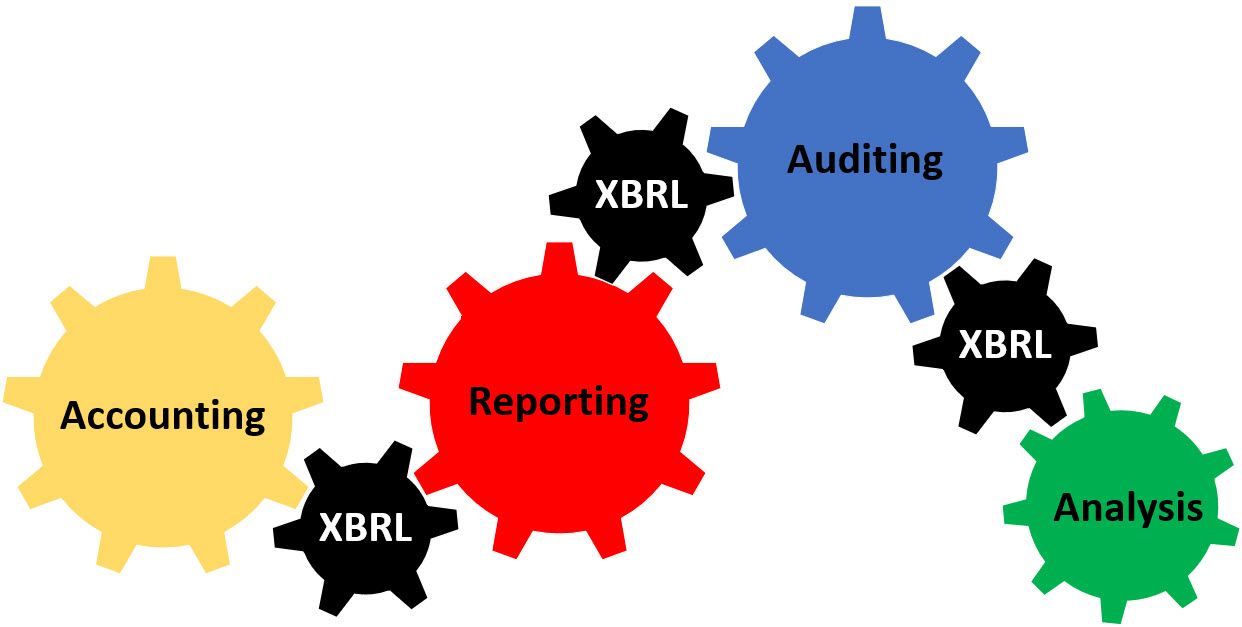
The aim here is continuous accounting, reporting, auditing, and analysis to the degree that this is practical.
What is your favorite accounting software? Why?
Charlie
in Digital Financial Reporting
|
Post a Comment
| Email
| Print
The Hidden Data Factory that Masks Process Problems
The Harvard Business Review article by Thomas Redman, Bad Data Costs the U.S. $3 Trillion Per Year, makes mention of the author calls "the hidden data factory" where U.S. organizations waste $3 trillion correcting errors made by others in the same organization.
In another article, Martin Doyle differentiates prevention cost, correction cost, and failure cost, WHY DATA SHOULD BE A BUSINESS ASSET – THE 1-10-100 RULE. Essentially this describes what George Labovitz and Yu Sang Chang came up with in 1992 called the "1-10-100 Rule" and is widely used as a tool to describe efficiency. In summary:
- $1: Verifying and correcting information at the start is the least expensive way to make sure your information is clean and accurate. This is prevention cost.
- $10: Identifying and cleaning information after the fact is time consuming and resource intensive. This is correction cost.
- $100: Bad information may flow between sources, creating a waste of time and resources. This is failure cost.
Said another way, "An ounce of prevention is worth a pound of cure."
Lean Six Sigma techniques and philosophies which have been around for years seems to be completely unknown to accounting departments and auditors. Auditors I get; they bill by the hour.
I have demonstated that you can connect accounting, reporting, audit, and analysis processes. If that is hard to follow, try walking through this narrative to understand what I am trying to get at. Or, read the documentation. Or even better, try processing these files yourself.
If you have 100% of the information you need within a process to get information to flow effectively from one end to the other and if you have process control mechanisms in place then automation of certain specific tasks is trivial.
Even without the use of artificial intelligence accounting, reporting, auditing, and analysis processes would benefit. But with artificial intelligence this becomes a no brainer.
Charlie
in Digital Financial Reporting
|
Post a Comment
| Email
| Print
Does Anyone Else Grasp the Importance of This?
This page details what I explained in this blog post. I am curious as to whether anyone else grasps the importance of what I am seeing here: (if this makes sense to you, please let me know; if not, let me know what might be missing)
- Take a set of journal entries. Here they are in machine readable XBRL Global Ledger format and Plain Text Accounting format. Here is the same information in human readable Excel and PDF.
- Import the journal entries into an accounting system such as Ledger, hledger, my Microsoft Access Database, or any other accounting system for that matter. You can then do things with that information.
- Within the accounting system you can generate things like a trial balance of accounts (status of each account), a roll forward for each account (impact of transactions on account), filter information using the information provided in the journal entries.
- But, the accounts are a flat list.
- You can get a trial balance of accounts. You can get a summary of the changes grouped by the type of change. You can put those two together and get a roll forward of each and every balance sheet account: Cash and cash equivalents; Receivables; Inventories; PPE; Accounts payable; Long-term debt; Retained earnings.
- However, if you use information such as that provide in an XBRL taxonomy, about the model of a report; you can both organize the accounts into a hierarchy and control the process of creating such a hierarchy. Here is that XBRL taxonomy schema in machine readable form.
- Using only the journal entries and the XBRL taxonomy for the report you can generate a machine readable report; here is that XBRL instance. (Less than 100 lines of code were used to generate the information that makes up the XBRL instance, mainly a bunch of SQL INSERT statements.)
- The machine-readable journal entries, machine-readable report model, machine-readable reported facts, and machine-readable rules enable the automation of many audit tasks. For example, this analysis of transaction change codes by account is consistent with expected relations matrix was created simply by reading the XBRL-based journal entries. Variance analysis, peer analysis, many account analysis steps, and many other internal audit and external audit tasks and processes can be effectively automated.
- A software application can turn that XBRL instance into a human readable report. Here is that same report formatted as Inline XBRL. The report could be static like a traditional financial report or dynamic (think pivot table).
- If you don't like the auto-generated human readable report you can do a little more work to specify formatting; then you can generate a pixel perfect human readable rendering that is also machine readable. You can also generate PDF (that is from another example) if you desire using a similar process. (I don't have an example, but you could also generate a Microsoft Word document in this manner.)
- Both the Inline XBRL and the Raw XBRL enable information to be reliably extracted from the reports for down stream processes such as analysis of the information.
- This entire process is controlled and monitored by machine readable rules that will point out any mistakes in the information to the extent that machine-readable rules exist. Mathematical computations are monitored by rules, rules, and more rules. Structural rules monitor the information structure. Disclosure rules (i.e. reporting checklist) monitor what is disclosed as contrast to what is required. The more machine-readable rules, the more work can be automated.
- Quality control checks and third-party checks can be done using the machine-readable journal entries and reports to automate a portion of those processes.
- Professional accountants can focus on value-add activities such as financial analysis and less on the gruesome, grueling, monotonous, repetitive tasks.
This simple example has all the moving parts of a larger set of journal entries and a larger report, say the 10-K financial reports for a company like Microsoft. Apple, Amazon, Facebook, Google, and Salesforce all work the same way.
BOTTOM LINE: This is a demonstration of how to automate accounting, reporting, auditing, and analysis processes using the global standard XBRL and the Standard Business Report Model (SBRM). This example has 100% of the required information (i.e. metadata) to move from journal entries to report. This process was created in a Microsoft Access database application using mainly SQL queries and basic VBA programming. Likewise, all the rules used in the control/monitoring process were created in Microsoft Access. Off-the-shelf software for working with XBRL ran the rules. Four different software applications get identical results (XBRL Cloud XRun, XBRL Cloud web service, UBmatrix, Pesseract).
For more information see here and here. Information quality matters. Expose the hidden data factory that corrects errors.
Charlie
in Digital Financial Reporting
|
Post a Comment
| Email
| Print
