BLOG: Digital Financial Reporting
This is a blog for information relating to digital financial reporting. This blog is basically my "lab notebook" for experimenting and learning about XBRL-based digital financial reporting. This is my brain storming platform. This is where I think out loud (i.e. publicly) about digital financial reporting. This information is for innovators and early adopters who are ushering in a new era of accounting, reporting, auditing, and analysis in a digital environment.
Much of the information contained in this blog is synthasized, summarized, condensed, better organized and articulated in my book XBRL for Dummies and in the chapters of Intelligent XBRL-based Digital Financial Reporting. If you have any questions, feel free to contact me.
Entries in XBRL General Information (220)
Issues in Comparing SEC XBRL Filings
It is getting a little easier to communicate issues relating to XBRL reports. The biggest problem in doing this is that most people don't know how to "read" XBRL. But as software applications become available being able to understand these sorts of issues will become easier.
There are a number of issues relating to doing basic comparisons of SEC XBRL filings. I am fortunate enough to have been dinking around with XBRL for over 12 years now, I can pretty much look at XBRL instances and taxonomies and figure most things out. During this time I have built a multitude of software applications to help me read XBRL easier and communicate information to others. I have taken that up a notch, combining about 10 different software tools into one tool which I call my XBRL audit or query or analysis tool.
That XBRL audit/query/analysis tool can generate a report which focuses on networks (i.e. extended links), hypercubes (i.e. [Table]s in SEC XBRL filings) and dimensions (i.e. [Axis] in SEC XBRL filings).
Here are six different reports which I will use to make a few points. The analysis reports show different characteristics. The focus here is comparability of the XBRL instance information. I will look at how networks, hypercubes (i.e. called [Table]s in SEC filings), and dimensions (i.e. called [Axis] in SEC XBRL filings) impact comparability. So here are the reports with a bit of information about each report.
- Analysis of Apple SEC filing: Actual SEC filing. Note that all concepts reported are modeled within [Table]s, in the case of this filing, the [Table]s are always the same, "Statement [Table]".
- Analysis of Heinz SEC filing: Actual SEC filing. Note that not all concepts reported are modeled withn a [Table], you will see that many networks say "xbrl:No [Table] (None)" in the column headed "[Table] (i.e. Hypercube).
- Analysis of SEC Model Filing I created: Test SEC filing I created to make some points. Note that every concept is modeled within a [Table] which is similar to the Apple filing, but in my case every [Table] has a unique name which identifies the concepts in the [Table], rather than using "Statement [Table]" for every [Table]/hypercube.
- Analysis of Comparison Example ABC Company: Prototype GAAP filing created to test comparability. This was build to be comparable with the XYZ Company and QQQ Company filings below. Note that all three filings use [Table]s (which are called Fact Groups as they follow the straw man implementation of the Business Reporting Logical Model (BRLM).
- Analysis of Comparison Example XYZ Company: Prototype GAAP filings, built to be comparable with ABC Company above.
- Analysis of Comparison Example QQQ Company: Prototype GAAP filings, built to be comparable with ABC Company above.
To start off let me say that this is not about my personal view as to what should or should not be comparable, that is not the point. The point here is this: if you want comparability, there are ways to get it and there are ways to make comparability more difficult to achieve.
You may want to start off doing two things. First, scan each of the reports which I have linked to noting what you have in each report. Then, compare the reports looking for similarities and differences between the reports. If you are really interested in this and want to do some extra credit work, note that each of the analysis reports links to the actual XBRL instance. Take the actual XBRL instances and try to compare them in some XBRL analysis tool. Try to compare 1, 2, and 3. Then try and compare 4, 5, and 6.
OK, so to my points (it helps to open all 6 reports above in your browser and bounce between them as you read this):
- All information is "dimensional", don't confuse syntax and semantics. A lot of people freak out when you talk about XBRL and dimensions. The truth is that all information in XBRL is dimensional. The dimensions are expressed using different syntax options, but the information is dimensional. If you look at the column headed "[Axis] (i.e. Dimension)", you will always see three dimensions for every "chunk" (sets) of information: xbrl:Concept [Axis], xbrl:Entity [Axis], and xbrl:Period [Axis]. Other [Axis] may be added by taxonomy creators, or not.
- Comparability is impacted by what [Axis] you have and what level the [Axis] was defined. If different hypercubes have different [Axis], the information will not be seen as comparable by software. There is a higher probability of comparability if an [Axis] is defined at the "GAAP" level than at the company/filer level.
- Comparability is impacted by networks and hypercubes [Table]s. Just as with the [Axis], comparability is impacted by networks and hypercubes; and the level that networks and hypercubes are defined impact comparability. For example, note the Apple and Heinz filings, seeing that every network was defined by the filer. Therefore, no networks in either the Apple or Heinz filing are the same. If you look at the Model SEC filing, note that there are (illegally, the SEC does not allow this) a few US GAAP Taxonomy defined networks. If Apple and Heinz had both, say, used the US GAAP Taxonomy network for the "balance sheet", then one could get the "balance sheet" for both Apple and Heinz. If you contrast that to the ABC Company, XYC Company, and QQQ Company reports you will see that all but one network is the same in all three reports. The same deal with hypercubes. If one uses no hypercubes or uses hypercubes which are all the same then basically the hypercubes [Table]s are useless. But, if each hypercube is unique, the hypercubes can be used as a basis of comparison. In filings 4, 5, and 6 all the hypercubes are unique and one could use the networks OR the hypercubes as the basis for comparison. (Except for the last network (QA, Part 1: Variance Analysis) and hypercube (Variance Analysis, Gross Profit [Fact Group]) which were defined at the company/filer level, and therefore is harder to compare as a computer will not understand them to be the same.
- If networks or hypercubes are not the fundamental basis for comparison, what is?Suppose you want to go grab all the accounting policies for a filing. Or any set of anything really. Try to find those "chunks" (sets) of information in any one SEC XBRL filing, or even more useful in any two SEC XBRL filings so you can actually do a comparison. It does not appear to be possible at the network level. [Table]s are not comparable either. Comparisons of individual concepts is useful, but too detailed and the concepts are best understood within some context (i.e. some set of information, like a balance sheet).
Some people say that you can throw software at the issues shown above and let computers sort all this out. That can happen to a degree. For example, clearly you can write a program to go find "Assets" and "LiabilitiesAndEquity" and there is a good chance you found the balance sheet. But maybe not, you may have found a segment breakdown. Some things are possible using brute force and software, but one will still have to define the sets somehow.
Particularly for less sophistocated users trying to glean information from these filings, it would be better to use networks, hypercubes, and dimensions to define information rather than fight with them. The first three XBRL instances show the hard way, the last three show an easier way.
Which approach do you feel is best?
 Charlie
in Creating Investor Friendly SEC XBRL Filings, Modeling Business Information Using XBRL, Techniques and Trends, XBRL General Information, comparability
|
Charlie
in Creating Investor Friendly SEC XBRL Filings, Modeling Business Information Using XBRL, Techniques and Trends, XBRL General Information, comparability
|
 Post a Comment
|
Post a Comment
|  Email
|
Email
|  Print
Print
Harvard Business School: The Landscape of Integrated Reporting
Harvard Business School held a workshop, A Workshop on Integrated Reporting: Frameworks and Action Plan. As part of that workshop an eBook, The Landscape of Integrated Reporting, Reflections and Next Steps, was made available.
The executive summary of the workshop provides the following conference overview:
Business has lost society’s trust and must act to restore it. One way to do so is through ideas and processes that demonstrate that business cares about more than just profit. Integrated reporting is a way to show society that business cares, is holding itself accountable, and is measuring itself on matters that society cares about.
While perhaps a bit ahead of the curve, the timing is right to be holding this conversation and the topic is of great importance. Harvard Business School is committed to this subject, which is reflected in HBS’s own reporting efforts and by supporting this workshop.
The book is a collection of papers submitted to the conference and provides a summary of the current thinking on integrated reporting. The book is packed with information, about 334.
One of the interesting things in the ebook is this graphic (from page 324) which provides an example road map to the future. The graphic shows an evolution of the framework. The reason the graphic is interesting to me as it explains the process we are going through with SEC XBRL filings.
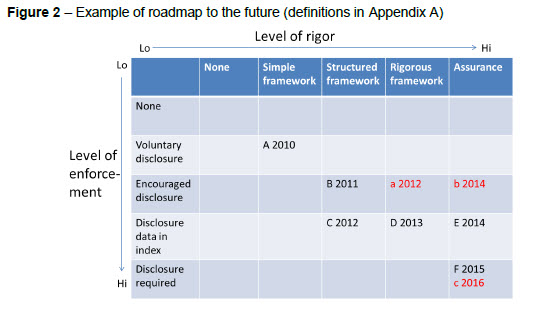
I like the way it shows an evolution from nothing, to a simple framework, to a structured framework, to a more rigorous framework, and then throwing in assurance.
In my view, that is similar to what is going on with SEC XBRL filings right now. We went from no XBRL filings, to a simple US GAAP taxonomy and a simple filing framework and XBRL instances. We learned from that. I think we are still in that simple framework level currently.
Over the coming years we will evolve to a more structured and rigorous US GAAP Taxonomy and SEC XBRL filings. A lot has been learned in the past couple of years; this will contribute to a more structured an rigorous, and therefore more useful, set of SEC XBRL filings.
Charlie
in Creating Investor Friendly SEC XBRL Filings, Modeling Business Information Using XBRL, XBRL General Information
|
Post a Comment
|
 7 References
| Email
| Print
7 References
| Email
| Print
Gartner: The 21st Century Disclosure Initiative Will Reprioritize Your BI and PM Strategies
This is a great Gartner research report: The 21st Century Disclosure Initiative will Reprioritize Your Business Intelligence and Performance Management Strategies. The punch line is:
Publicly traded companies should use these regulatory reforms to gain a competitive advantage, rather than treat them as a cost of doing business.
The research report discusses how the "last mile of finance" will change, the benefits of the change, and approaches to implementing these changes within your organization.
In my view these changes will not be limited to public companies. Private companies reporting to their financial institutions in support of commercial loans is the obvious next step.
Further, the report points out the benefits structured data provides internal information systems.
Many people make the mistake of asking, "What it costs to add XBRL to a business report." The equation has two parts: cost and benefit. Another logical question one might ask is, "What is the cost of not having XBRL tagged business information." As more and more information becomes available in an XBRL format, comparing the true costs and benefits will become easier.
As these net benefits are seen, more and more organizations will realize that the "outsource" and "bolt-on" options are less favorable than an embedded or integrated approach to implementing XBRL. Perhaps not for everyone, but for many.
Charlie
in General Information, Last mile of finance, US SEC, XBRL General Information
|
1 Comment
| Email
| Print
The Implications of Supply Chain Standards for Accountants
In an article published for Chesapeake System Solutions, Standardize to Streamline - The Implications of Supply Chain Standards for Accountants; Mike Willis, Partner, PricewaterhouseCoopers and Chairman, XBRL International; summarizes the benefits standards offer to streamline processes.
Standardize to Streamline
The benefits of supply chain standardization in the retail grocery segment accrued to producers, distributors, retailers and consumers. The entire supply chain benefited from a six-fold increase in product diversity.
Yesterday I posted an entry on this blog, Road Work Ahead: Last Mile of Finance, which delivers a similar message. Accounting and financial reporting processes are changing. These changes are not unique to accounting and financial reporting, other industries are being impacted. Mike gives the example of the retail grocery supply chain. In another blog postI pointed out some things health care are up to in this area.
Charlie
in General Information, Last mile of finance, XBRL General Information
|
Post a Comment
| Email
| Print
Road Work Ahead: Last Mile of Finance
It looks like there is road work ahead for the "last mile of finance". In an FSN article, "Tagetik goes head to head with Oracle and Clarity (now IBM) in the ‘Last Mile’ of Finance" the IBM acquisition of Clarity is hailed as a wake up call:
The IBM deal is a wakeup call to the market – expect to see much activity in this space over the coming year.
I am hearing terms that I have never heard before: Disclosure Management and Collaborative Disclosure Management (CDM). This seems to be a new class of software.
While business intelligence (BI) software was generally used for consuming information, this new class of software is for creating information. Enterprise Performance Management (EPM) seems to be the buzz word for consuming financial information.
As I mentioned in a blog post several months ago, Oracle Hyperion Disclosure Management and Oracle Hyperion Financial Close Management work in conjunction with other Oracle EPM applications such as Hyperion Financial Management or can be deployed directly with ERP General Ledger systems. SAP has its offerings for reporting. IBM with their acquisition of Clarity means they are in the game.
Those names I have heard before. It seems like every day I get the name of another software product that either can be used to create financial information or consume financial information. Here are some: Information Builders, Tagetik, Quantrix, WebFilings, Trintech and Longview Solutions. There are likely many others.
In 2008 Gartner and Ventana Research white papers described ineffecient corporate reporting process which they predicted would change. (See Gartner's XBRL Will Enhance Corporate Disclosure and Corporate Performance Management and Ventana's Selecting the Right XBRL Solution: Addressing Compliance Requirements and Automating the External Reporting Process.) This is Ventana's description of the process:
Thus, the current close-to-file process is structurally prone to error. It poses a risk that mistakes and misstatements will occur. Most companies deal with this potential for errors and the risks they pose with a brute-force approach, using well-paid professionals (who could be doing more productive things) to check and double-check the documents. This might be a workable approach today, but it becomes increasingly difficult and costly as the amount of required tagging increases.
These large number of spreadsheets and word processing documents and the highly manual, time consuming and error prone process they require is the approach of today. It is like a dirt road. The tools of the future will be more like an interstate freeway.
While external financial reporting and regulatory reporting are paving the way, the change which will occur will impact all business reporting, not just financial reporting.
XBRL is only part of the change, I guess I would call it a trend. I am hearing the term "model based reporting" come up. This is a new way to think about business reporting. The electronic spreadsheet was a significant improvement over the paper-based spreadsheet. These new tools will be an improvement to the electronic spreadsheet.
So get your hard hats. Road work ahead.
Charlie
in General Information, Last mile of finance, XBRL General Information
|
Post a Comment
| Email
| Print

