BLOG: Digital Financial Reporting
This is a blog for information relating to digital financial reporting. This blog is basically my "lab notebook" for experimenting and learning about XBRL-based digital financial reporting. This is my brain storming platform. This is where I think out loud (i.e. publicly) about digital financial reporting. This information is for innovators and early adopters who are ushering in a new era of accounting, reporting, auditing, and analysis in a digital environment.
Much of the information contained in this blog is synthasized, summarized, condensed, better organized and articulated in my book XBRL for Dummies and in the chapters of Intelligent XBRL-based Digital Financial Reporting. If you have any questions, feel free to contact me.
Entries from May 1, 2015 - May 31, 2015
Understanding the Taxonomy/Ontology Life Cycle
Just like many other things a taxonomy or ontology has a life cycle. The paper Towards ontology evaluation across the life cycle explains the problem of not understanding that life cycle and not being able to evaluate the quality of an ontology:
Problem: Currently, there is no agreed on methodology for development of ontologies, and there is no consensus on how ontologies should be evaluated. Consequently, evaluation techniques and tools are not widely utilized in the development of ontologies. This can lead to ontologies of poor quality and is an obstacle to the successful deployment of ontologies as a technology.
The paper points out that there are five aspects to the quality of ontologies which need to be evaluated:
- intelligibility
- fidelity
- craftsmanship
- fitness
- deployability
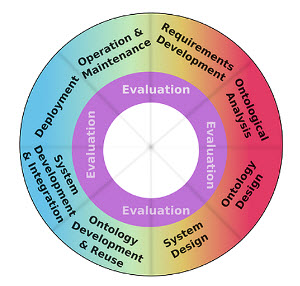
The paper provides this diagram of the different stages of the taxonomy/ontology life cycle:
 F. Neuhaus et al. / Communiqué
This is a list of the stages which are explained in the document:
- System design
- Ontology design
- Ontological analysis
- Requirements definition
- Operations/maintenance
- Deployment
- System development and integration
- Ontology development and reuse
I missed this in my chapter on Knowledge Engineering Basics for Professional Accountants, but will add it in the very near future.
 Charlie
in Becoming an XBRL Master Craftsman
|
Charlie
in Becoming an XBRL Master Craftsman
|
 Post a Comment
|
Post a Comment
|  Email
|
Email
|  Print
Print
Libraries of Queries for SECXBRL.info
I have been fiddling around with SECXBRL.info for quite some time. 28msec is pretty liberal about making the service available. The DOW 30 information is available for free. If you sign up, which is also free, you basically have access to all information for all the companies who file 10-K and 10-Q filings except for trusts and funds.
(NOTE that SECXBRL.info change the beginning of the URL to http://secxbrl.28.io/v1/ and the public token to c3049752-4d35-43da-82a2-f89f1b06f7a4 The queries need to be adjusted for those two changes.
I create some documentation a while back which shows how to create: (some of these might need updating)
To make this even easier to understand, I create the following example queries and reports which also includes 28msec's new spreadsheet-to-report type queries. Here are those.
- RSS Feed of queries comparing IBM and Microsoft: A set of 6 queries which compares IBM and Microsoft.
- Compare IBM and Microsoft: Demonstrates how you can embed queries within a web page and render multiple queries together on one page. (This uses the queries in the RSS above and simply organizes the queries in an HTML page using iframes.)
- RSS Feed of 27 fact queries: Set of 27 different fact queries which returns results in a common fact table format.
- Compare across entities (RSS Feed): Set of queries which demonstrate how to compare information across entities. This uses the spreadsheet-to-report to return human readable results. (also available in RDF)
- Compare across periods (RSS Feed): Set of queries which demonstrate how to compare information for the same entity across periods. Also uses the spreadsheet-to-report human readable format. (also available in RDF)
This stuff is really getting useful!
Charlie
in Becoming an XBRL Master Craftsman, Demonstrations of Using XBRL
|
Post a Comment
| Email
| Print
Understanding Blocks, Slots, Templates, and Exemplars
A little application called Scratch which was created by MIT shows those who have a little imagination where digital financial reporting is headed;
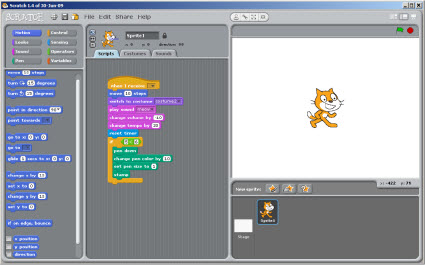 (Click image to go to Scratch website)
If you need a little more help getting your head around that idea, the document Understanding Blocks, Slots, Templates and Exemplars helps business professionals begin to understand how digital financial reporting will eventually work.
Software engineers use patterns to implement software. A financial report is not one big thing, it is a many little things. The notion of block, slot, template, and exemplar help give software engineers things to work with to implement sophisticated software that is easy for business professionals to use.
Imagine accounting professionals interacting with this:
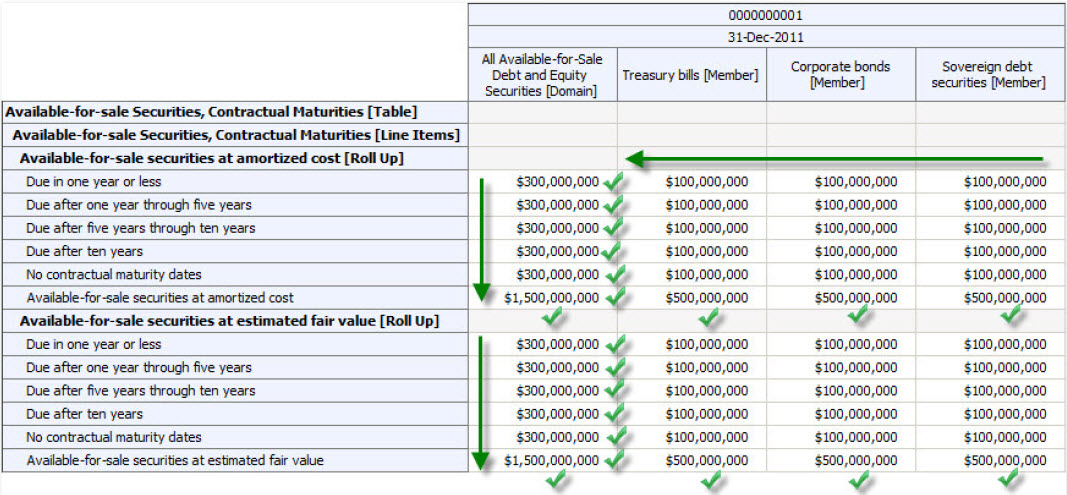 (Click image for larger view)
Technical? Absolutely that is technical. Just not information technology-technical; it is accounting-technical. And that is exactly what professional accountants shoud be working with, accounting related stuff.
Can anyone explain to me why digital financial reporting software cannot work has I have described in the document? Everything is glued together with business rules understood by professional accountants. Software does more to help accounting professionals get things right, rather than give them more opportunities to make mistakes.
Why can't this work?
More information:
Charlie
in Becoming an XBRL Master Craftsman
|
Post a Comment
| Email
| Print
Understanding that XBRL-based Digital Financial Reports are made up of Distinct Identifiable Pieces
Did you know that the 2014 10-K financial filings submitted to the SEC by public companies reported a total of 8,816,913 facts? Here is other information: (from the 6,751 reports analyzed)
- 7,404,893 (or 84%) of facts were reported using base concepts from the US GAAP XBRL Taxonomy.
- 1,412,020 (or 16%) of facts were reported using extension concepts created by the reporting entity.
- 495,825 networks were used to organize the reported facts.
- 73 networks were used on average per report, with a range between 5 and 321 networks.
- 1,306 facts were reported per report, with a range between 31 and 33,216 reported facts.
- 5,226 (or 77%) entities reported using classified balance sheets
- 110 (or 1.63%) entities reported income (loss) from equity method investments after tax and as part of special reporting items
There is a lot more interesting information. The document Understanding that XBRL-based Digital Financial Reports are made up of Distinct Identifiable Pieces summarizes that information and much, much more.
But the primary thing the document does is prove beyond a shadow of a doubt that (a) digital financial reports are made up of lots of distinct identifiable pieces, (b) what those pieces are and, (c) what the relations between the pieces are.
Why is this important? This information is very helpful in creating software useful to business professionals to create digital financial reports correctly. Errors such as the minimum criteria can be avoided by having software manage the mindless tasks of keeping these sorts of details consistent so that business professionals can focus on the aspects of such reports which require judgement.
Still don't understand why all this is important? Then you need to brush up on your knowledge engineering skills.
If you do understand, then the next thing you will want is this concise summary of the things and relations between things which make up a financial report. The next step is to distill the pseudo code into machine-readable business rules. Why is that needed? To build useful software.
Charlie
in Becoming an XBRL Master Craftsman
|
Post a Comment
| Email
| Print

