BLOG: Digital Financial Reporting
This is a blog for information relating to digital financial reporting. This blog is basically my "lab notebook" for experimenting and learning about XBRL-based digital financial reporting. This is my brain storming platform. This is where I think out loud (i.e. publicly) about digital financial reporting. This information is for innovators and early adopters who are ushering in a new era of accounting, reporting, auditing, and analysis in a digital environment.
Much of the information contained in this blog is synthasized, summarized, condensed, better organized and articulated in my book XBRL for Dummies and in the chapters of Intelligent XBRL-based Digital Financial Reporting. If you have any questions, feel free to contact me.
Entries from October 1, 2019 - October 31, 2019
How to Survive and Thrive as an Accountant in the Digital World
What will become of human professional accountants in a world where computers play an increasing role in accounting, reporting, auditing, and analysis?
As in many other spheres of knowledge touched by digital; accountants who survive and thrive will have an intimate understanding of the limitations of their machine assistants. These accountants will be part accountant bringing their broad domain knowledge, have good understanding of the real capabilities of their machine-based collaborators, and adept at asking valuable “what if” type questions which are beyond the capabilities of machines.
Artificial Intelligence and Knowledge Engineering in a Nutshell is an excellent place to start to increase your digital maturity and adapt to changes caused by the Fourth Industrial Revolution.
Global Standard Drilldown Complements of XBRL
This is one of the most interesting working prototypes that I have created. What is so interesting is that you can drill down from the primary financial statements, to the roll forward provide for EVERY balance sheet account, to the subclassifications roll up provided for most accounts, to the trial balance summary, to the changes summary (i.e. summary of changes by change category), and ultimately to the journal entries that caused the change in a account.
Here is a video that shows the drilldown and drillup functionality. (Note that the XBRL Cloud evidence package provided does not support "drill down" functionality but the XBRL Cloud viewer does. Pesseract does support drilldown.
So how does the drilldown/up work? For the statements, when a fact is shared between two report fragments the fragments are "hooked together" by that fact. For example, the line item "Property, Plant and Equipment" on the balance sheet is also the beginning and ending balance of the Property, Plant, and Equipment Roll Forward and the total of the breakdown of Property, Plant and Equipment subclassifications.
But how do you get to the journal transactions?
Basically, every balance sheet account has a roll forward which can be created. Most accountants don't look at it this way because clearly you don't disclose a roll forward for every balance sheet account in your external financial statements. But think about this differently. Think about this in terms of your internal financial statement.
Every accountant understands the notion of a trial balance.
The trial balance is a listing of the "real accounts". A "real account" is a balance sheet account, it is either an asset, a liability, or equity. (See Elements of Financial Statements.) Nominal accounts are the revenues, expenses, gains, and losses that are reported on the income statement and then ultimately run through the equity roll forward when you close your trial balance. This is the "articulation" of the four statement model.
Every accountant knows that if you add up all the real accounts in the trial balance the total of all the accounts will add up to ZERO when you consider the DEBITS and the CREDITS.
What about if you added up all the TRANSACTIONS? Every transaction balances, debits equal credits. And so, it is also true that the sum of all the transactions will equal zero.
What if you grouped each transaction not by the chart of accounts account that is impacted, but rather by the change that the transaction causes.
That is what the change summary shows. Rather than grouping transactions by the chart of accounts code, you create a code to represent where they would show up in the account roll forward of each account. I discussed this in the documents Introduction to the Fact Ledger and General Ledger Trial Balance to External Financial Report.
So what you do is code each transaction with one of those change summary codes and then you can drill down from a balance sheet account, to the roll forward for that account, and from the roll foward change that you want to look at all the way back to the journal entries that show the transactions that comprised that change.
You will note something in the change summay. You will see the change code "Repayment of Long-term Borrowings" and "Repayment of Long-term Borrowings 2". Remember that accounting is double entry, every transaction will show up in TWO roll forwards. So, one part of the transaction is the cash that was used to repay long-term debt; the other part of the transaction is the actual reduction of long-term debt becaue of the cash repayment. This is normal. I will create better transaction code names.
Here is the initial prototype of the journal entries. The volume of journal entries is not high but it demonstrates the idea effectively.
More to come so stay tuned.
 Charlie
in Becoming an XBRL Master Craftsman
|
Charlie
in Becoming an XBRL Master Craftsman
|
 Post a Comment
|
Post a Comment
|  Email
|
Email
|  Print
Print
Integrated Building Blocks, Articulation, and Intermediate Components
A financial report is a type of the more general business report. A financial report is “bounded” by the rules of double-entry accounting. That is what differentiates a financial report (bounded by the double-entry accounting model) from a business report (NOT bound by the double-entry accounting model).
The basic high-level model of double-entry accounting is described by the accounting equation which is a logical statement:
Assets = Liabilities + Equity
Standards setters create financial reporting schemes . Within those financial reporting schemes, the standards setter expands on the accounting equation in slightly different ways per the specific needs of that specific financial reporting scheme. But by definition a standards setter cannot violate the accounting equation. These rules that essentially expand the accounting equation tend to be outlined along with other important information within a conceptual framework for that financial reporting scheme. The financial reporting scheme essentially defines a core set of classes of elements used by that financial reporting scheme which reconciles to the accounting equation.
The elements of financial statements are the building blocks, or classes of defined elements, with which financial statements are constructed by an economic entity reporting per some financial reporting scheme.
The items in the financial statements of a specific economic entity represent in words and numbers certain entity resources, claims against those resources, and the effects of transactions and events, circumstances, and other phenomenon that result in changes in those resources and claims.
These classes of building blocks are intentionally interrelated mathematically within the four core statements that make up a financial report; this is called 'articulation'.
Intermediate components, i.e. subtotals, can be used to represent the items of an economic entity within the items that comprise a financial report of the economic entity. However, these intermediate components and the items must fit into the core framework of the classes of elements that are the building blocks of a any financial report created using a specific reporting scheme.
The high-level model of a financial report and double-entry accounting can be represented within the XBRL technical syntax and then used to both explain a financial report model and verify that the financial report model is consistent with that explanation.
I have done exactly this for US GAAP, IFRS, and FRF for SMEs so far. Others are coming soon.
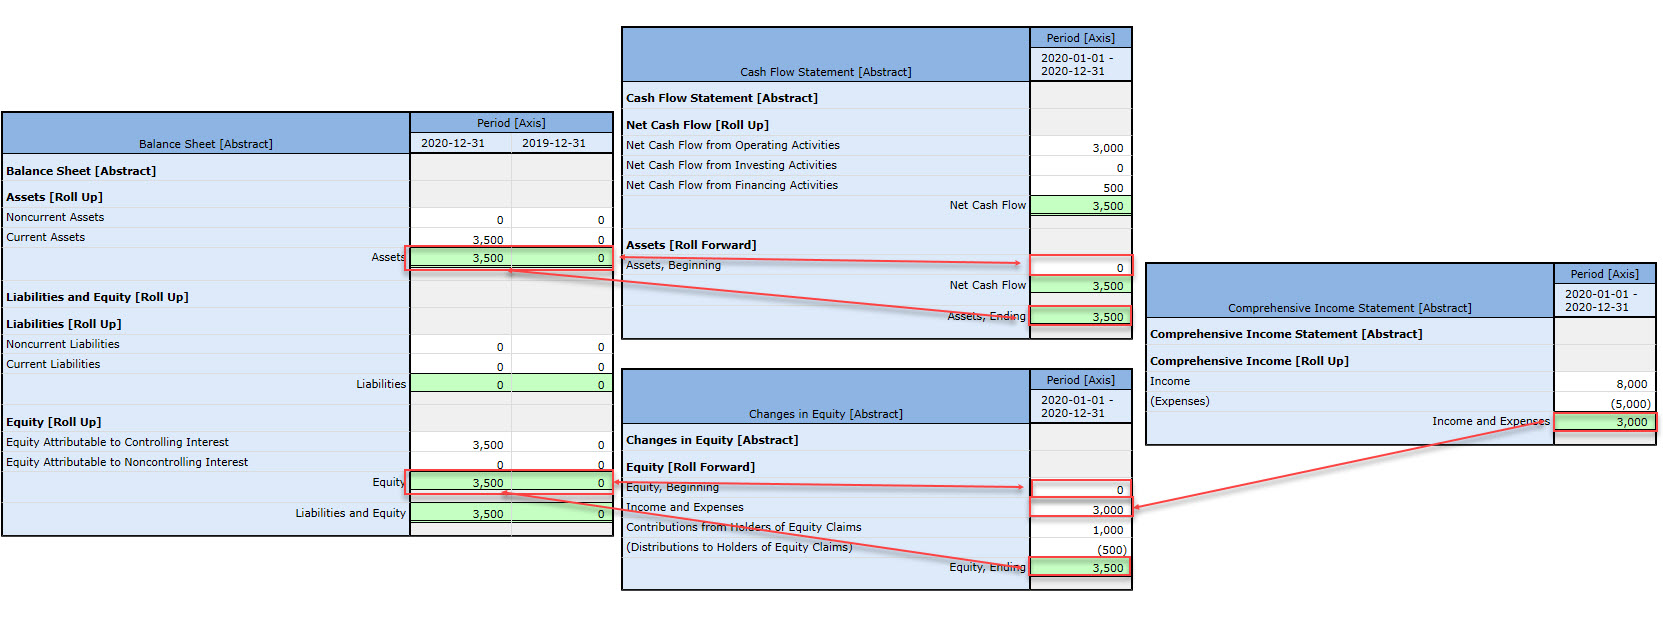
The four primary financial statements form the high-level structure of a financial report. Many other things in the report must fit into that core structure.
The balance sheet provides a roll up of assets, a roll up of liabilities and equity, and is bound by the rule “Assets = Liabilities + Equity”. The income statement is used to compute the roll up total “Net Income” and there are rules for how the intermediate components (i.e. subtotals) of Net Income roll up. Net income then flows to the statement of changes in equity which is a roll forward which reconciles beginning and ending equity on the current and prior balance sheets. The cash flow statement is a roll up of Net Cash Flow, rules that specify how the intermediate components (i.e. subtotals) of net cash flow roll up, and a roll forward of the asset Cash and Cash Equivalents which reconciles the beginning and ending balance of that asset on the balance sheet.
While the model shown above which is based on “Assets = Liabilities and Equity”; some economic entities use different sorts of models. For example, some economic entities report using a liquidation basis style balance sheet where “Assets - Liabilities = Net Assets”. “Net Assets” and “Equity” are two different labels for what is the same concept.
Using the rules of mathematics, the equation “Assets = Liabilities + Equity” can be converted to “Assets - Liabilities = Equity”.
So, while a financial report is not a static form it is not random either. Financial reports follow patterns and these patterns can be explained using specific models to account for and manage the variability inherent in a financial report. Each set of items in the financial report of an economic entity must follow the accounting equation and the elements of a financial statement defined by some financial reporting scheme.
About 90% of XBRL-based financial reports submitted to the SEC using US GAAP follow what one might expect. About 10% don't. Software needs to make it so that professional accountants creating such reports succeed in getting 100% of such representations correct.
Charlie
in Becoming an XBRL Master Craftsman
|
Post a Comment
| Email
| Print
Disease Ontology Example
The disease ontology has some interesting ideas for organizing information. This paper provides some good information about that ontology. Perhaps some of these ideas might be useful for financial reporting.
Charlie
in Becoming an XBRL Master Craftsman
|
Post a Comment
| Email
| Print
Grant Reporting Efficiency and Agreements Transparency Act of 2019
The U.S. Senate passed the Grant Reporting Efficiency and Agreements Transparency (GREAT) Act of 2019. This is sort of similar to the Financial Transparency Act.
This is what the GREAT Act would do.
Charlie
in Digital Financial Reporting
|
Post a Comment
| Email
| Print

