BLOG: Digital Financial Reporting
This is a blog for information relating to digital financial reporting. This blog is basically my "lab notebook" for experimenting and learning about XBRL-based digital financial reporting. This is my brain storming platform. This is where I think out loud (i.e. publicly) about digital financial reporting. This information is for innovators and early adopters who are ushering in a new era of accounting, reporting, auditing, and analysis in a digital environment.
Much of the information contained in this blog is synthasized, summarized, condensed, better organized and articulated in my book XBRL for Dummies and in the chapters of Intelligent XBRL-based Digital Financial Reporting. If you have any questions, feel free to contact me.
Entries from October 4, 2009 - October 10, 2009
Organizing Networks and Hypercubes to Get a Flow
You have all those concepts in an XBRL taxonomy schema. You can organize those into useful groups of information. This is done by putting concepts into a network (i.e. presentation, calculation, definition). You can further organize these into hypercubes if you want to use the multidimensional model.
But, how do you organize the networks and/or hypercubes? This is what I mean by flow. (Go to that blog entry for more information on flow.)
Consider this fairly simple example of a financial statement. Here is how I did it:
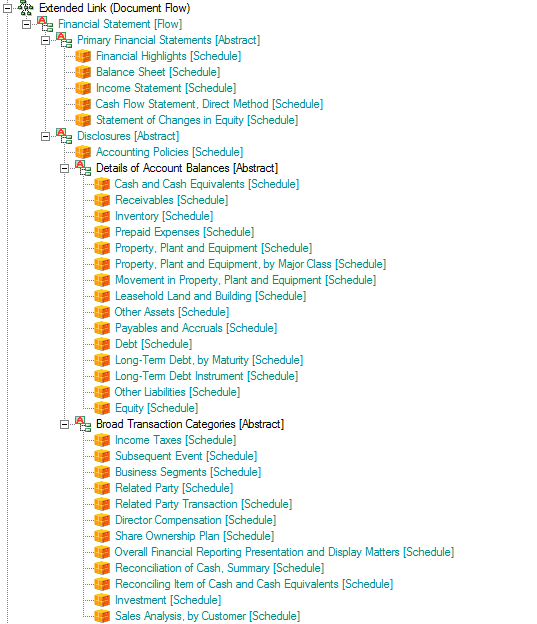
What I did was the following:
- Create a definition network. I created the network role of http://www.example.com/DocumentFlow. (You could do this using the presentation network, but if you use the definition network you can create custom arcroles, I will get to that in a moment.)
- Create an arcrole if you want, but I just used the "general-special" arcrole for now.
- Use abstract concepts and the hypercubes you have created in your taxonomy to organize the flow of the report.
Here is another version of that screen shot, an HTML page where you can see both the flow and the other parts of the XBRL taxonomy.
There are some important characteristics of networks and hypercubes which you need to understand in order to understand the issues and solve them.
- There is no way to order networks in XBRL. Or rather, there is no standard way. You can always create a proprietary way, but the problem is that if users are using different software applications they will very likely get different results. Two ways to overcome this are to (a) use the physical order in which the networks appear or (b) sort the networks by their definition. Sorting by the definitions of the networks is how the US GAAP Taxonomy was built to be used, that is why the numbers are in the network definitions.
- There is no way to provide a hierarchy of networks in XBRL. You can order the networks by using one of the two approaches above, but that approach limits you to a flat sorted list. It would be nice if you could put the networks into a hierarchy, like the taxonomy concepts themselves.
- You cannot "jump" between networks. A good way to understand this is to say that you can jump between networks in the definition linkbase if you use XBRL Dimensions. This is achieved using the targetRole attribute. What this allows is for pieces of a hypercube (the dimensions, the domains, the members, the primary items) to be defined within different networks (i.e. extended links of the same role) but then use them together. This is a very handy feature. But again, it does not exist in XBRL 2.1, only in XBRL Dimensions.
- Hypercubes are XBRL taxonomy schema XBRL elements all of which have the substitutionGroup value of "xbrldt:hypercubeItem".
- So, to organize the hypercubes into a flow, I simply create a network which includes only abstract elements which provide a means of adding hierarchy or structure and then put each hypercube into that structure in the order that I want to see it.
Now, there are some subtleties which are helpful to understand. To make this work, you should give each hypercube a unique name. If you do this, the network really becomes irrelevant from a flow perspective, as the hypercube becomes your way to identify which piece of the taxonomy you want to point to. Besides, personally, I believe that it is a good idea to give each unique hypercube a unique name which describes what that hypercube is trying to communicate. In contrast, the US GAAP Taxonomy used the same hypercube "Statement [Table]" for every primary financial statement. For example, here that one hypercube is used to define a balance sheet and here that very same hypercube is used to define an income statement. What that means is that you MUST use the network in addition to the hypercube to identify the hypercube. Whereas, if the names were unique, you would only need the hypercube name to identify the hypercube. The fact that the US GAAP Taxonomy uses the same hypercube to mean different things, the approach outlined above will not work for that XBRL taxonomy. So, when you build your XBRL taxonomy, I would suggest making each hypercube name unique.
Then, what this allows is an interfact which looks something like this. Notice the flow on the left. Each hypercube shows up in the list, they can be read from the "flow" network which you define. Click on the hypercube, and that hypercube is rendered in the right side pane.
That flow network allows for two things: First, you can define the order that you want. Second, if other users don't like your flow, the can change it by simply creating an extension to the XBRL taxonomy! Altertatively, they can simply create their own flow network in the form of an XBRL taxonomy.
For example, you could put line items, policies, and disclosures which relate to each other together as you see desire. Interactive information!
 Charlie
in Flow, Modeling Business Information Using XBRL, XBRL General Information, hypercubes, networks
|
Charlie
in Flow, Modeling Business Information Using XBRL, XBRL General Information, hypercubes, networks
|
 Post a Comment
|
Post a Comment
|  Email
|
Email
|  Print
Print
Microsoft FRx in Microsoft Dynamics GP Supports XBRL
Seems as thought Microsoft has joined the list of accounting vendors who support XBRL. Microsoft FRx in Microsoft Dynamics GP supports XBRL. See this white paper.
Charlie
in XBRL General Information
|
Post a Comment
| Email
| Print
Extention Points and Extensibility Rules
I was very fortunate to participate on the team that created the US GAAP Taxonomy Architecture. Part of this is how could you not learn a lot discussing things with people like Walter Hamscher, David vun Kannon, Campbell Pryde, Paul Sappington and Cliff Binstock (i.e. the other co-authors of the architecture).
Part of what we discussed and to a degree addressed in the US GAAP Taxonomy or realized that we could not address was the notion of extension points and extensibility rules. These topics had come up before, we drilled into them in greater detail in creating that architecture. Here are general definitions of these two terms:
- Extension points: logical points in a taxonomy where extension makes sense. These are generally technical in nature.
- Extensibility rules: rules relating to where a taxonomy can be extended. These are generally domain related and have to do with semantic meaning.
Looking at a taxonomy will help make the difference between the two make more sense.
Extension points
Take a look at the figure below (for more information see the "Calculation" metapattern on this page, number 3):
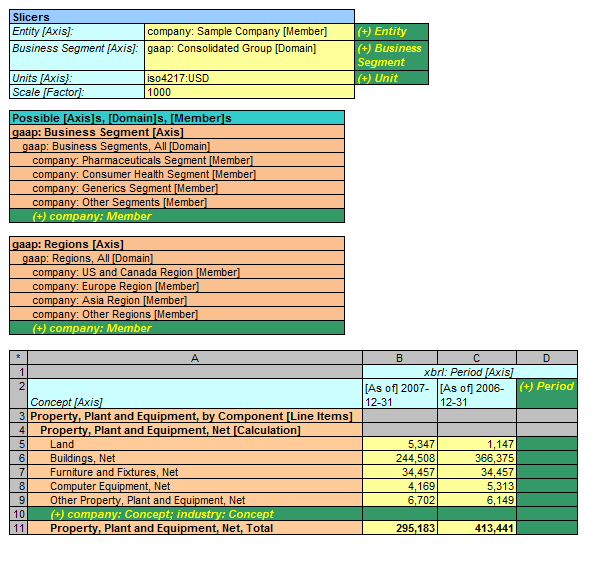
The green areas in the graphic are extension points. It makes sense to add new members to a domain, new periods, perhaps new units, and a new concept to the list of concepts which make up some total. For example, on row 10 above, it makes sense to add the concept "Airplanes" to an extension taxonomy and put it in that precise location in an XBRL taxonomy which extends another taxonomy. Likewise, it makes NO sense to do things like add a member as a child of the concept "Land". These extension points are incredibly helpful to understand for a lot of different reasons. One reason is that software can be built to make creating or extending an XBRL taxonomy a whole lot easier if these extension points are known, they are consistent, and they are communicated in some manner by the creators of a base XBRL taxonomy which someone else is extending. I could go on and on pointing out good and bad examples, but I think you probably see the point here.
In the US GAAP Taxonomy does have extension points, even though they are not formally communicated. For example, see section 4.5 Implementing Tables in the US GAAP Taxonomy Architecture document (page 34). Realizing this can help you to more easily create appropriate extension taxonomies.
Extensibility Rules
Extensibility rules are different from extension points, but they can be very helpful in another way. So, as an example, imagine the US GAAP taxonomy. (Or you can go look at it here.)
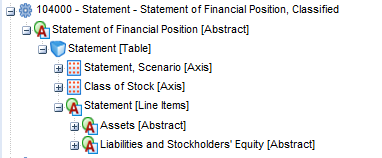
Consider the concepts "Assets [Abstract]" and "Liabilities and Stockholders' Equity [Abstract]". From a financial reporting business domain perspective, what sense does it make to add a concept into the US GAAP Taxonomy as a sibling to those two concepts? What would that concept be? Well, it doesn't make sense in this particular case, a balance sheet has two things which when added up the totals should be the same: total assets and the total of liabilities and equity. That is why it is called a balance sheet.
There are other areas of a taxonomy where this same thing is true, extensions make no sense. For example, a cash flow statement breaks cash flows into three categories: operating, financing, and investing. That is dictated by the financial reporting literature.
What other areas does it make sense to not allow extension or two allow extension? Should users of the US GAAP Taxonomy be able to add balance sheet line items? Well, there are actually pros and cons to that. On the one hand, what line item would they possibly want to add? If it should be there, it probably already exists in the US GAAP Taxonomy. On the other hand, it was not the case that things like Goodwill or Intangible assets ever existed on anyone's balance sheet. But, finance reporting standards evolved, and these line items are in the financial reporting rules. Allowing extensions at certain points really relate to financial reporting standards, not XBRL.
Generally it is the case that the deeper you get into a tree of concepts, the higher the probability that extension should be allowed. The higher you are in a tree of concepts, the less likelihood that you would need to extend the US GAAP Taxonomy. There are plenty of excepts to this rule, but in generally, that statement is fairly accurate.
How do you communicate extension points and extensibility rules?
Well, there is no standard way to do that now and there is no formal articulation if this information. This holds true for the US GAAP Taxonomy, the IFRS taxonomy and any other taxonomy which is out there really.
But why WOULD you communicate this information? Well, say there were a way to automate the process of detecting when a user extended a taxonomy in the wrong area (violated an extension point) or that the put a net tree of concepts on the balance sheet as a sibling of assets and liabilities and equity (violated an extensibility rule) and you could point this out to the user. Or even better, the application simply would not let you make that mistake. Or how about if a wizard lead you through the process of extending or building a taxonomy because the wizard had knowledge of such extension points and extensibility rules. Wouldn't that be helpful to users? I think so.
Charlie
in Modeling Business Information Using XBRL, Tips, Tricks and Traps, US GAAP Taxonomy, XBRL General Information, extensibility rules, extension points
|
Post a Comment
| Email
| Print
Updated Interactive Information Viewer
I have created an updated "interactive information viewer" based on a bunch of work I have done trying to understand how to best render XBRL information in general and specifically for financial reporting. Details of what I am seeing can be found in these three blog entries:
- Thoughts on Rendering (First Installment)
- Thoughts on Rendering (Second Installment)
- Thoughts on Rendering (Third Installment)
My next step will be to update the comprehensive example which looks a little more like a financial statement to take advantage of the things which I have learned in this little exercise. These are the test cases I am using to try and pull all these pieces together:
- Metapatterns: http://www.xbrlsite.com/Demos/Metapatterns/2009-03-14/
- Business use cases: http://www.xbrlsite.com/Patterns/2008-04-18/
- Comprehensive example: http://www.xbrlsite.com/examples/ComprehensiveExample/
If anyone has any better ways to get to the right result, I would love to hear from you.
The goal which I am striving toward is to make the following work for XBRL in general and XBRL specifically for financial reporting:
- Business users can do all of this without the IT department getting involved (ease of use)
- Extensibility which works correctly (not forms)
- Rendering which is easy and interactive (not static renderings)
- Does everthing which is needed today plus more (new beneficial features)
- Global, open standard (not proprietary to one software vendor)
Charlie
in Demonstrations of Using XBRL, Modeling Business Information Using XBRL, XBRL General Information, XBRLS, interactive information hypercube
|
Post a Comment
| Email
| Print
Thoughts on Rendering (Third Installment)
(This is a continuation of the post "Thoughts on Rendering Second Installment").
The first and second installment of these thoughts relating to rendering XBRL lead to this third installment. Be sure to go back to the other two posts. Also, be aware that this post may seem to ramble. That is brainstorming, trying to figure this out. A conclusion will be reached, bear with the process. If you just want to skip to the conclusion below, you can do so.
First, let me summarize the requirments of what I am trying to achieve:
Requirements:
- A human readable rendering usable by business users across different software applications (i.e. proprietary means of exchanging information already exist, but they are proprietary and don't work across different software applications).
- Reconfigurable information (i.e. interactive information, or interactive data as the SEC refers to it), for example much like you can reconfigure information using a Microsoft Excel pivot table.
- Extensibility has to be supported
- Business users must be able to perform all aspects of this process without the IT department getting involved (i.e. it is actual quite easy to exchange information if you do get the IT department involved).
- Automationof the process (i.e. you can already exchange information in a non-automated manner, for example exchanging an Excel spreadsheet, but you cannot reliably automate that process).
Here are prototypes of the outputs of the process (you have to use your imagination here and try and meld these different pieces together into a hybrid of something which does not exist today):
- Goal: This is a two dimensional depiction of the output, it gives you a sense of what the information might look like so you can see what you would get in terms of a "human readable rendering."
- Automated so far: This is where I have been able to get to thus far, this is 100% automated. This was created using the "inputs" which will be discussed in a moment.
- Interactive characteristics: This is an example of the "interactive" characteristics of the information. I would imagine that this would better be created using something such as Adobe FLEX or Microsoft Windows Presentation Foundation which are allow for very flexible interfaces to be created.
- Automation characteristics: This Microsoft Excel application pulls in prototype XBRL instances created using the information model discussed below. Basically, this is not about reading information from a web page, it is about automating the reliable exchange of information. Although, users will need to read that data to check on things as they deem appropriate.
OK, so how do you get to the set of outputs described above and meet the requirements which we started out with? That, still, is the $64,000 question. Here are the inputs which are needed in order to make this work, it seems:
- Some global standard: To be non-proprietary, clearly we need a standard. XBRL is a standard, so that fits.
- A data model: To exchange information you have to be able to define that information. XBRL let's you do that with an XBRL taxonomy so that the creator of the information and the consumer of the information can be on the same page and truly automate the process. But while an XBRL taxonomy is necessary, it is not sufficient. Now, the trick is that you still have to keep it standard XBRL.
- An information model: An information model of some sort is needed. What that means is that everyone cannot create arbitrary or random XBRL taxonomies and expect the information exchange process to be (a) easy for business people and (b) automatable. Every major XBRL taxonomy today has some sort of explicit or implied (i.e. undocumented information model). Random XBRL taxonomies simply will not work. The US GAAP Taxonomy, COREP, XBRLS all have documented information models which you can work with.
- Hypercubes: You simply cannot take a wide variety of different pieces of information and expect a rendering engine to render the pieces which have vastly different characteristics well. But, if you do what BI (business intelligence software) does and use the multidimensional model, you create cubes of information (or really hypercubes), you can break the larger set of information down into small enough pieces so that the pieces which need to fit together do fit together, and they can be rendered. Basically, all the information in a hypercube has the same "shape".
- Flow: The hypecubes need to be organized, there is a flowto a business report. So, you need some mechanism for organizing the hypercubes.
- Multidimensional model: You need some mechanism to allow you to reconfigure the information, to enable the interactivity piece of the equation. Lots of different approaches would work. One approach used is the multidimensional model. The US GAAP Taxonomy uses that, COREP uses it, and XBRLS uses it. But what you don't seem to need is the OLAP piece which seems to get in the way of rendering information correctly.
- Metapatterns: The information model may need metapatterns which further break down an information model. Although, that may not be the case. I can see that a well articulated taxonomy could have the needed information gleaned from it using things which are rigid enough in XBRL to be predictable. These include the way XBRL Dimensional information is articulated within the definition linkbase, the way XBRL calculations are articulated, the way XBRL Formulas works. On the other hand, those structures do need to be created in some manner. I cannot see business users doing this. However, if you distill information down into a number of metapatterns and then use those metapatterns to drive application interfaces, then this task will be made quite simple for business users within software applications. I see three metapatterns at this time: roll up, roll forward, hierarchy. There are likely more metapatterns, adding new ones is not a problem. Not having them makes working with the information model exponentially more complex, even to the extent that business users simply cannot work with the technology.
Conclusion
Given the requirements, the output goal, the inputs discussed above (and additional details of those inputs discussed on the previous two blog posts related to rendering XBRL and other information all of which is somewhere on this blog), this is what I see:
- Three pieces needed for rendering: I see three pieces needed for rendering XBRL given the requirements above. The first pieceis that you need well organized network/hypercubes articulated within a specified information model making the use of metapatterns to succinctly articulate the information you desire to exchange. An example of this is provided by the following in XML and in HTML. These well organized pieces allow for the possibility of rendering and the possiblitiy of extendeing the information model in a predictable manner. The second piece can be seen from this datacube of this application which reads datacubes. The third pieceis a set of dimensions. This expressed both in the XBRL taxonomy and in XBRL itself. The entity, period, and units are dimensions, whether they are called dimensions by XBRL or not.
- A rendering algorithm: You need an algorithm for rendering this information. You only get those three pieces above for rendering because that is all that an XBRL taxonomy and an XBRL instance provide. But, that seems to be enough. Although you cannot know for certain until you actually SEE the rendering algorithm work within a software application. There are three parts to this rendering algorithm. The first two are fairly easy, the second seems to be more challenging than I can handle, but I think a good programmer can make it work. Here are the parts: (1) You need to identify the set of information you are working with, that is what the hypercubes do. Because of the way XBRL work, you can do one of two things. Make each hypercube unique within a taxonomy or use the network/hypercube combination to uniquely identify the sets. (2) You need to identify which dimensions are fixed and therefore can be put into the category of "slice" because they apply to every fact value, and which are unique to fact values and therefore need to appear in the fact table. (3) You need to use the XBRL taxonomy structure, the dimensions, and the fact values to build a fact table which a human can understand and read. THAT is the part part! The fact table is the piece of this that I cannot get to work because of my lack of programming skills, it is the colorful piece of this document. All I can do is list the facts, I cannot put them in order or get the right dimensions. The dimensions could be in a slice, they could be in the fact table, or they could be grouped within the fact table.
Now, granted...none of this may be clear to you, it may take some effort to understand all these moving pieces because this information is not that well organized. I have to figure out a better way to communicate this information. But, I think I am right about what I see and am definitely willing to be wrong if someone has a better idea. But, until I see the requirements stated above being met, I will assume that I am at least on the right track.

