BLOG: Digital Financial Reporting
This is a blog for information relating to digital financial reporting. This blog is basically my "lab notebook" for experimenting and learning about XBRL-based digital financial reporting. This is my brain storming platform. This is where I think out loud (i.e. publicly) about digital financial reporting. This information is for innovators and early adopters who are ushering in a new era of accounting, reporting, auditing, and analysis in a digital environment.
Much of the information contained in this blog is synthasized, summarized, condensed, better organized and articulated in my book XBRL for Dummies and in the chapters of Intelligent XBRL-based Digital Financial Reporting. If you have any questions, feel free to contact me.
Entries from July 6, 2014 - July 12, 2014
Understanding OData
I stumbled across a new technical syntax which is very, very interesting: OData. This video provides a good explaination of what OData is and why it exists. The synopsis is that OData is a web protocol (i.e. uses HTTP) for querying and updating data. There are two formats: JSON and ATOM. You can kind of think of it as a relational database on the web.
Here is an example of OData. If you are familiar with Microsoft Access and the Northwind sample data, here is Northwind expressed as OData using the ATOM format: (this is best viewed in Google Chrome because you can see the XML)
- Database: This link is to "the database" itself. It in essence lists the tables and queries which are contained in the database. It is a set of collections which are available.
- Customers: This is the "customers" collection or table.
- Regions: This is the "regions" collection or table.
- Products: This is the "products" collection or table.
I could do more, but you get the idea.
You can find additional information on OData on this blog.
What is the most interesting is this. Recall the "regions" collection mentioned above. Check this out.
So what is going on is this. OData is a format readable by Tableau Public. Why is this important? The primary reason is that it allows you to create a LIVE DATA FEED!
I will show you more reasons this is important. Stay tuned!
 Charlie
in General Information
|
Charlie
in General Information
|
 Post a Comment
|
Post a Comment
|  Email
|
Email
|  Print
Print
SEC Crackdown Begins
The SEC sent out a friendly letter to filers. The letter included this statement:
Acceptance of your filing by EDGAR does not mean that your filing is complete or in compliance with the Commission's requirements.
Given that providing proper calculation relations for roll ups is only one of many, many things necessary to make sure an SEC XBRL financial filing is correct, I would suspect that the SEC will be sending more friendly letters.
In addition, the SEC provided this Staff Observations which was basically complaining about the use of extension concepts, particularly by small filers.
For those who want to proactively get their ducks in a row, this document, Digital Financial Reporting Principles, will keep you ahead of your competitors.
"Quality means doing it right when no one is looking." - Henry Ford.
Wired: How Many Spreadsheets Does it Take to Run a Fortune 500 Company?
A Wired article asks the question, How Many Spreadsheets Does It Take to Run a Fortune 500 Company? The article points out that companies rely on spreadsheets to fill gaps in company systems. The article asks the question, "Does it work?"
I say a better question is, "Is there a better way?" Personally, I think there is a better way. Here is a collection of blog posts related to spreadsheets:
- Great Video about the Issues with Spreadsheets
- Need for a Global Standard Spreadsheet Alternative
- Time for a New Take on the Electronic Spreadsheet
- Semantic Spreadsheet
- Updated Vision of the System
- Radically Tailorable Tool
- End-user Computing: Business Users Building Software
This is the key point in that Wired article:
The problem is that we always build enterprise software by starting with a static data model or an object model, and then we're surprised when the resulting systems are inflexible. What if we took different approach? What if we turned the problem upside down? Instead of a static data model, we build services around a Modeling Engine that is purpose built to change dynamically.
What I am calling a semantic spreadsheet is not totally flexible like an electronic spreadsheet. It is flexible exactly where you need flexibility, but no where else. For example, if you tried to express a balance sheet in an Excel spreadsheet you can absolutely create a balance sheet because you have 100% control, to the extent that Microsoft Excel has features, therefore you have that same level of flexibility.
But that is not what a business user needs to create a balance sheet. Business uses don't need infinite flexibility to mask the reality that the electronic spreadsheet does not understand balance sheets, what business users need is for the application to understand balance sheets! The spreadsheet needs to understand that a balance sheet has "assets", it has "liabilities", it has "equity", that "assets = liabilities + equity", that assets can be current and noncurrent, and that property, plant and equipment is a noncurrent asset.
The business user interacts with the balance sheet model, not the raw electronic spreadsheet model. The raw electronic spreadsheet model knows nothing about balance sheets, that causes the following: (a) the user of the electronic spreadsheet needs to know more about balance sheets and (b) the electronic spreadsheet has to be overly flexible because it does not understand what you can and cannot do when you create a balance sheet.
How the heck do you get an application to understand a balance sheet? Machine readable metadata. You define "things" such as assets, liabilities, equity, current assets, noncurrent assets, etc. You define "relations between things" such as "assets = liabilities + equity". You do this for every disclosure.
Sound like a lot of work? It is a lot of work. The US GAAP XBRL Taxonomy is a huge step in this direction. But what is even better is all the balance sheets and other disclosures submitted to the SEC by public companies in the form of digital financial reports. I don't want to go into details here, just know that it is not as much work as it might seem.
First, it is create once, use many times. Second, it is way more effective and efficient for a computer to manage as much of this complex process as possible rather than rely on humans who make mistakes, who change jobs, and who are expensive. Humans will certainly be necessary, but machines will be able to assist humans.
So you will not only be working with a modeling engine, you will be working with a financial report modeling engine. Don't understand all this? Go read the Financial Report Semantics and Dynamics Theory. That proves that SEC XBRL financial filings fit into a model.
There will be other types of modeling engines: not-for-profit financial report modeling engine, state and local governmental financial report modeling engine, pension plan financial report modeling engine, expense report modeling engine, purchase order modeling engine, and so forth. Purpose built and specific driven by machine readable metadata, not infinitely flexible electronic spreadsheets.
Think of this as radically tailorable software, business users configuring software using metadata.
Charlie
in Creating SEC XBRL Financial Filings
|
Post a Comment
| Email
| Print
Updated Digital Financial Reporting Principles
Looking at individual SEC XBRL financial filings is helpful. Looking across many, many SEC XBRL financial filings with a focus on one specific thing at a time is likewise beneficial. Carefully and consiously comparing and contrasting many SEC XBRL financial filings helps one build a mosaic, increasing ones understanding of digital financial reporting.
I have updated the document Digital Financial Reporting Principles. This is still a draft, but an improvement over the prior version.
While that document is extremely helpful to external financial reporting managers to make them conscious of what it takes to create a correct and usable digital financial report, such as an SEC XBRL financial filings, there is another use for that document: for creating better software.
If a software developer endeavored to understand that document they would realize all the features they could add to their product to help external financial reporting managers to both be conscious as to what tasks they need to perform to get their digital financial report correct and more importantly that the software could do to help the user!
Business rules are not the enemy, they provide the salvation. Business rules is what will make digital financial reporting work.
The question is not whether software vendors will or will not implement these rules. I can pretty much guarantee that they will. They really have no choice. The question is how they will implement the rules.
This is a summary of the things which contributed to improvements in this version as compared to the prior version of this document:
- Digital disclosure checklist framework
- Digital disclosure checklist components
- Understanding minimum processing steps for effective use
- Summary information about evaluating against the minimum criteria
- Mind boggling diversity SEC XBRL financial filings
- Choice of Financial Reporting Supply Chain: Guessing Game or Not?
- Analysis of 6,644 SEC XBRL Financial Filings
- Financial report ontology
- Prototype tool for viewing disclosures (Web Application)
The document Digital Financial Reporting contains important background information which is helpful in understand the digital financial reporting principles. Financial Report Semantics and Dynamics Theory is also an important document.
Charlie
in Becoming an XBRL Master Craftsman
|
Post a Comment
| Email
| Print
Testing Tableau Public: (Imagine digital financial reports working this way)
This is a test visualization I created using Tableau Public. What I did was create a Tableau visualization, save it to Tableau Public, and then embed the visualization object into my blog entry. This is a direct link to this prototype test visualization: (Shows information about the number of networks and the total reported facts of the Fortune 100 companies. Also provides information about who the generator was)
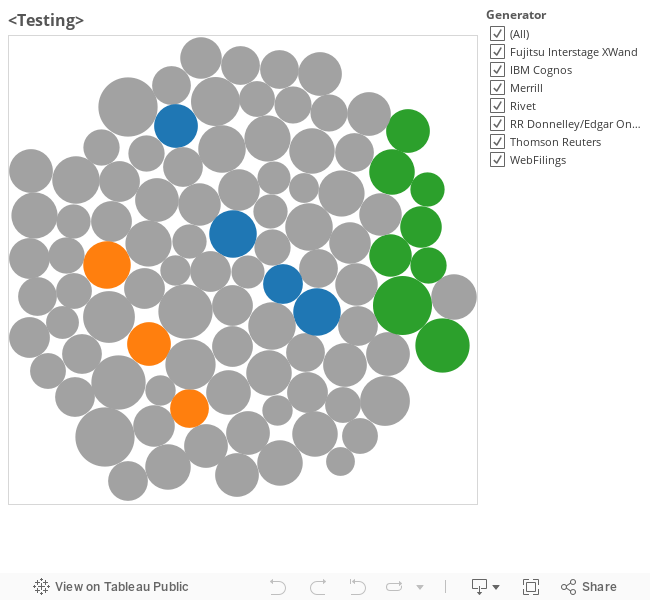
Couple of things to note.
- It took me about 45 minutes to create this prototype, I have never used Tableau before.
- Tableau supports Excel, CSV, TXT, and some other formats but does not support XBRL directly. You can convert XBRL to CSV, such as using the SECXBRL.info web service (here is an example)
- What Tableau seems to do is upload your data into their database. Not sure if you can create visualizations which automatically update if data changes. For example, it would be great if I could hook the Tableau visualization to the SECXBRL.info web service which provides information in the CSV format.
- Unfortunately, Tableau seems to be forcing OLAP on you similar to Excel pivot tables and other BI type applications. Hopefully I am wrong, but that is what I see. On the other hand, they do have both measures and attributes. So I could be wrong about this. (Hopefully I am wrong)
- What I find incredibly interesting is that newspapers are embedding these dynamic visualizations into their news stories. For example, check out this Seattle Times article. Here is another in the Sydney Morning Herald
What if information from a digital financial report could be worked with in this manner? Imbed into analysis reports. Drill down from analysis reports to the actual report (i.e. SEC XBRL financial filing).
Charlie
in General Information
|
Post a Comment
| Email
| Print

