BLOG: Digital Financial Reporting
This is a blog for information relating to digital financial reporting. This blog is basically my "lab notebook" for experimenting and learning about XBRL-based digital financial reporting. This is my brain storming platform. This is where I think out loud (i.e. publicly) about digital financial reporting. This information is for innovators and early adopters who are ushering in a new era of accounting, reporting, auditing, and analysis in a digital environment.
Much of the information contained in this blog is synthasized, summarized, condensed, better organized and articulated in my book XBRL for Dummies and in the chapters of Intelligent XBRL-based Digital Financial Reporting. If you have any questions, feel free to contact me.
Entries in Creating Investor Friendly SEC XBRL Filings (222)
Commentary and References Demonstration
XBRL has some interesting and very useful features...which few people seem to know about or use. One of those features is the ability to add commentary and examples using the XBRL label linkbase or the XBRL references linkbase.
I created some demo commentary linkbases for US GAAP and IFRS a while back.
The following commentary linkbases and references linkbases build on those examples:
- Commentary for IFRS FULL 2017
- Commentary prototype created for IFRS BOX, IFRS FULL 2017
- Examples prototype created for my comparison examples, IFRS FULL 2017
- Examples prototype created for IFRS BOX, IFRS FULL, 2017 (only two of these links work related to net cash flows)
So what exactly is going on? Essentially, what I am showing is that if software vendors create their software correctly, you can pull resources directly into their software and expose those resources to users without the software vendors having to write a single line of code.
I will provide more information and maybe a video later on this topic.
 Charlie
in Becoming an XBRL Master Craftsman, Creating Investor Friendly SEC XBRL Filings
|
Charlie
in Becoming an XBRL Master Craftsman, Creating Investor Friendly SEC XBRL Filings
|
 Post a Comment
|
Post a Comment
|  Email
|
Email
|  Print
Print
Breaking Down XBRL-based Financial Reports
I am analyzing the last 10-K of each of 5,734 public companies that submitted financial reports to the SEC as of March 31, 2018. This number of filings "5,734" differs from the two sets of that I measured in my quarterly analysis of public company reports.
My analysis of the fundamental accounting concept relations is for the LAST REPORT FILED and that last report could be a 10-K or a 10-Q. That total is 5,856. The reason I use the last report filed is because fundamental accounting concept relations could have been fixed since the companies last 10-K. (Here is a comparison of fundamental accounting concept relations measurements for the past three years.)
My analysis of the reporting checklist and disclosure mechanics is for the LAST 10-K reported, but when I ran that analysis XBRL Cloud was inadvertenly including 272 funds and trusts in that list which I did not want to work with, so that total is 6,006. (Here is a summary of the reporting checklist and disclosure mechanics measurements which I just started in March 2018.)
But for the analysis I am doing now I am working with the 5,734 10-Ks of public companies as of March 31, 2018.
Here is some information about that set of 5,734 XBRL-based financial reports.
- There are 7,948,552 facts reported by those companies in those 5,734 reports.
- The average report contained about 1,386 facts.
- The report with the most number of facts reported 29,247 facts.
- The report with the least number of facts reported 14 facts.
- The reports contained 447,715 networks which are used to organize those facts into sets.
- The report with the must number of networks provided 310 networks.
- The report with the least number of networks provided 1 network.
- The reports contained 5,553,445 presentation relationships (which I call the model structure) between the Networks, Tables, Axis, Members, LineItems, Abstracts, and Concepts that were used to represent the information in the reports.
- 5,553,245 of those relations were as expected
- 200 of those relations were inconsistent with expectation meaning that there was some sort of mistake, this is down from prior year measurements.
In those 5,734 10-K financial reports there were 311,000 text blocks reported using concepts from the US GAAP XBRL Taxonomy. There were about 964 different text blocks that fell into three SEC/FASB categories:
- Level 1 Note text blocks that were used to represent entire notes.
- Level 2 Policy text blocks that were used to represent individual accounting policies.
- Level 3 Disclosure text blocks that were used to represent individual disclosures.
I am not analysing the Level 4 Disclosure Detail here. I compare Level 4 Disclosure Detail and Level 3 Disclosure Text Blocks here.
What I am doing here is to compare how public companies use specific text blocks. Here is information about those text blocks:
- Here is a complete list of different text blocks in the US GAAP XBRL Taxonomy (note that this is the 2018 taxonomy, it is slightly different than the 2017, 2016, and 2015 which were used to submit reports)
- Here is a list of 17 text blocks that I have created comparisons for every public company that uses each specific text block to see HOW they are using it.
- Here is one comparison, the Nature of Operations Level 1 Note text block.
What is very useful about these comparisons is that you can see how different public companies use these text blocks. I did a specific analysis of the Level 3 Disclosure text block related to the disclosure of the components of property, plant, and equipment. See the full comparison here. Here are some individual observations:
- Most public companies use the text block "us-gaap:PropertyPlantAndEquipmentTextBlock" to represent the components of PPE which tends to look like this.
- A good chunk of public companies include the estimated useful lives of each category of PPE in that text block, which tends to look like this.
- A small minority use that text block to disclose ONLY the estimated useful lives of PPE categories.
- A small minority include depreciation expense AND the breakdown of PPE components.
- A minority include PPE components in their PPE policy text block.
Clearly all of these four cannot be considered correct. My personal view is that #1 is correct. #2 should be broken down into TWO separate disclosures in my view; one for the roll up of PPE components and another for the estimated useful lives. #3 clearly cannot be considered correct, it does not match what most public companies do and it does not match the documentation of the text block. #5 likewise is clearly not correct, PPE components go into the level 3 disclosure text block not the policy.
What causes these sort of issues is a "presentation" orientation when thinking about how to represent these disclosures. If a "representation" of information orientation were taken, how things should be represented becomes more clear.
What do you think? More analysis coming, so stay tuned.
Charlie
in Creating Investor Friendly SEC XBRL Filings
|
Post a Comment
| Email
| Print
Quarterly XBRL-based Public Company Financial Report Quality Measurement (Mar 2018)
The following is a summary of the quality measurements of XBRL-based financial reports submitted to the SEC as of March 31, 2018. The following Excel spreadsheets and other documents provide details related to these quality measurements:
- Narrative which further explains these measurements
- ZIP file containing Excel spreadsheet with details of errors
- ZIP file containing Excel spreadsheets which has pretty good (i.e. not commercial quality, but close) working validator and validation of 3,945 XBRL-based financial filings, about 67% of all such reports
- 10-K metadata for 6,005 public companies (easy to work with XML infosets; fairly large, takes about 10 minutes to download)
- Extraction tool
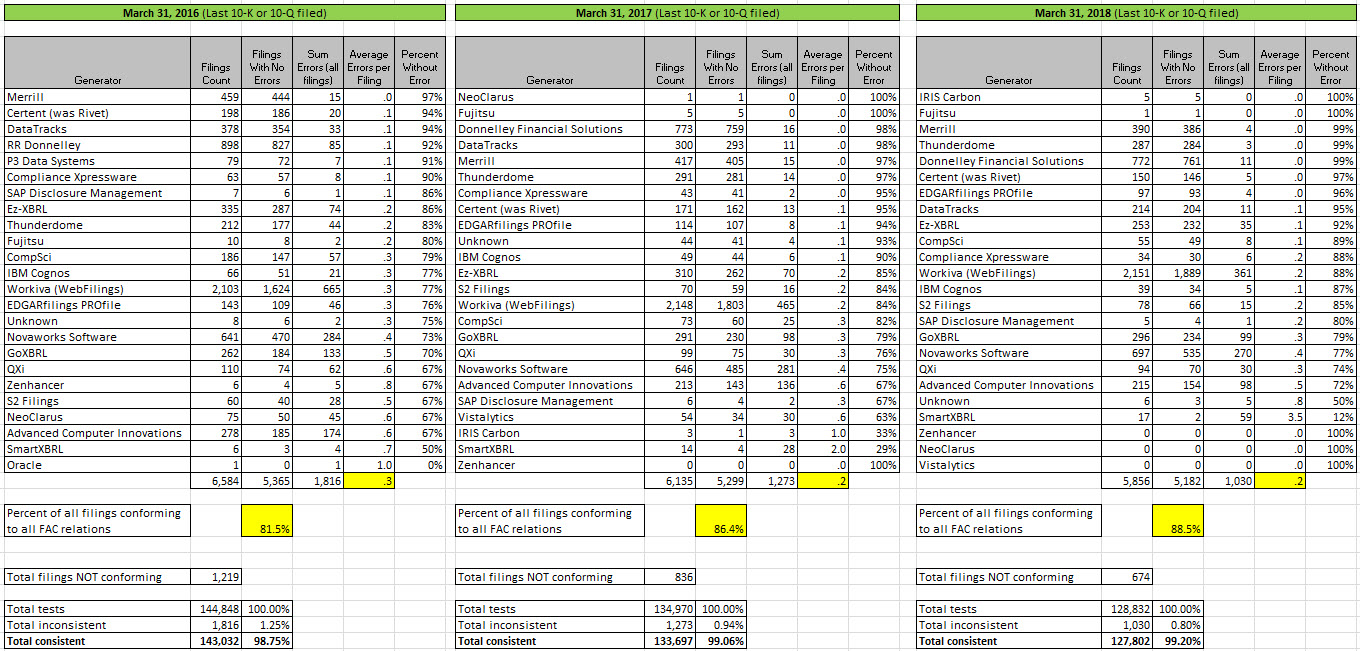
In summary, fundamental accounting concept relations quality has steadily improved each year as can be seen by the three year comparison. On an individual test basis, each of the 22 relations tests is 98% consistent with what is expected. 88.5% of all XBRL-based financial reports are consistent with all 22 relations tests as would be expected. The goal as I see it is that all XBRL-based financial filings are 99.99966% consistent with expectations (six sigma).
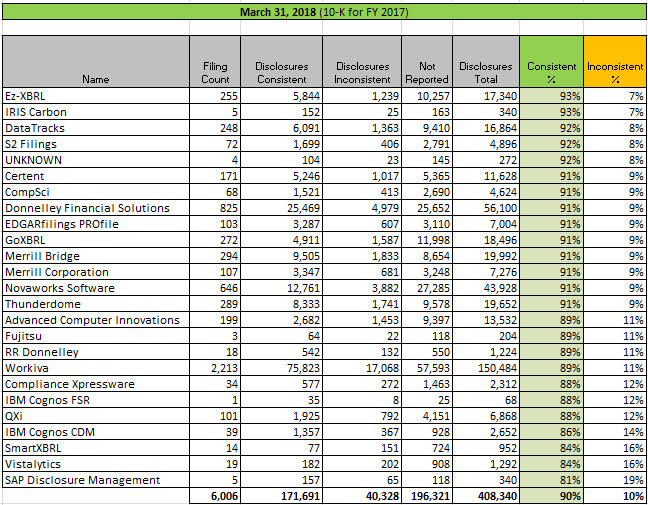
I have added measurements of what I call the disclosure mechanics of 65 disclosures. Disclosure mechanics quality has increased from 88% to 90% for the 65 disclosures I am measuring. Again, the goal is six sigma for every disclosure reported.
The following are graphical summaries:
Fundamental accounting concept relations for last 10-K or 10-Q filed by generator of the report:
 (Click for larger image)
Fundamental accounting concept relations by relation test (same filings as above):
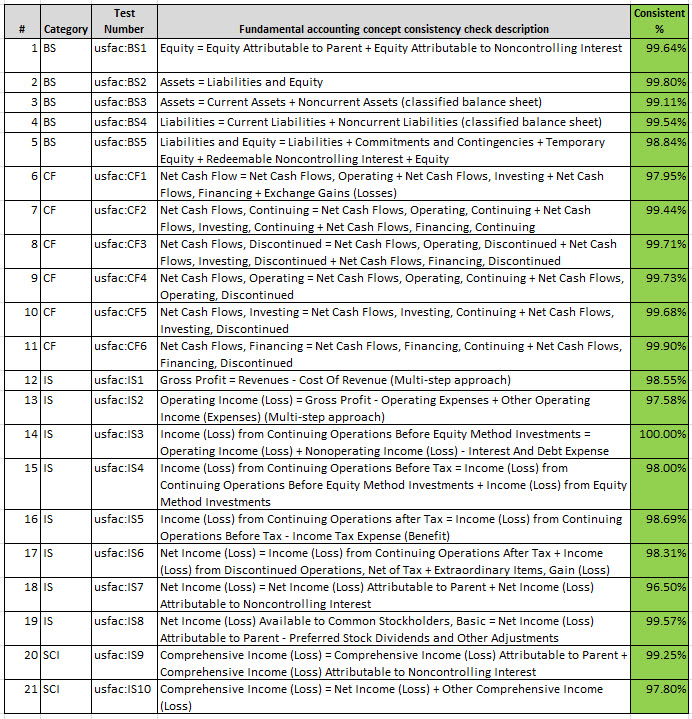 (Click image for larger view)
Comparison of 2016, 2017, and 2018 fundamental accounting relations results:
 (Click image for larger view)
Disclosure mechanics by generator results from analysis of last 10-K filed with SEC as of March 31, 2018:
 (Click image for larger view)
Disclosure mechanics results by disclosure:
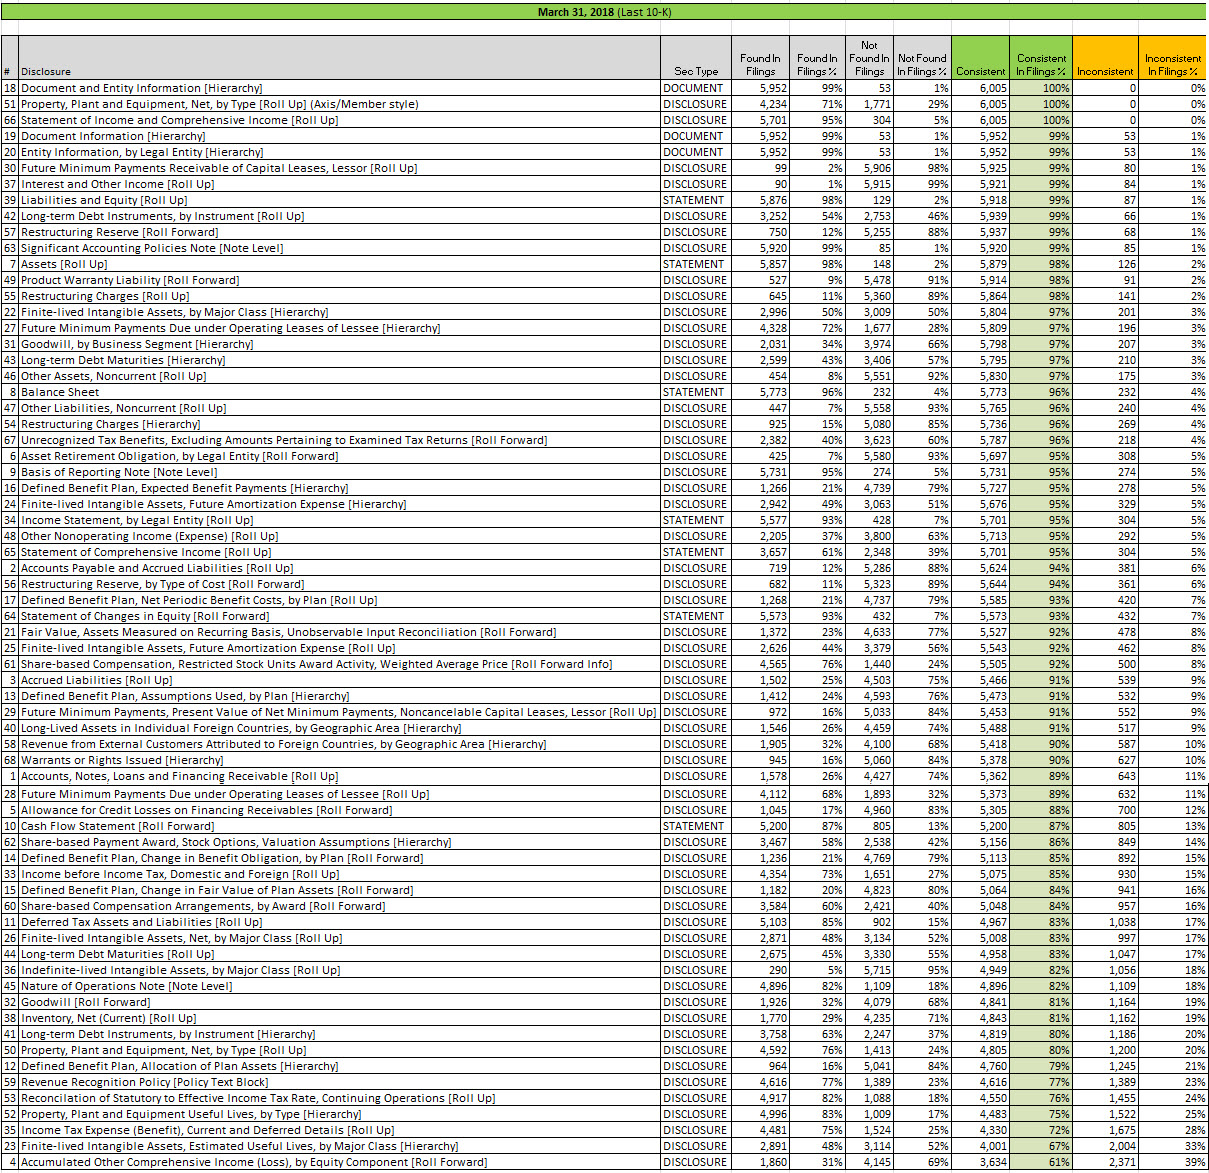 (Click image for larger view)
I will likely put together a narrative that explains these measurements in more detail.
**********************PRIOR RESULTS**********************
Previous fundamental accounting concept relations consistency results reported: November 30, 2017; August 31, 2017; May 31, 2017; March 31, 2017; November 28, 2016; August 31, 2016; June 30, 2016; March 31, 2016; February 29, 2016; January 31, 2016; December 31, 3015; November 30, 2015; October 31, 2015; September 30, 2015; August 31, 2015; July 31, 2015; June 30, 2015; May 29, 2015; April 1, 2015; November 29, 2014.
Charlie
in Becoming an XBRL Master Craftsman, Creating Investor Friendly SEC XBRL Filings, Digital Financial Reporting
|
Post a Comment
| Email
| Print
Disclosure Best Practices (Prototype)
I have perfected what I call a Disclosure Best Practices resource. I am envisioning this as a resource for intermediate accounting students to begin with. Then it could be expanded and made useful to professional accountants that external create financial reports.
This early prototype which took the form of a document helps you understand where this Disclosure Best Practice resource is going. The conceptual model of a financial report also helps you understand this resource.
There are two important things that might not be apparent by just looking at this resource. First, the information you see is 100% machine readable as well as being readable by humans. Second, the organization of the information into the form you see is 100% automated. That organization is achieved using metadata from the conceptual model.
If you don't understand this Disclosures Best Practices resource or why it is important, you should consider reading the document Closing the Skills Gap.
The foundation for this Disclosures Best Practices is the Reporting Checklist and Disclosure Mechanics machine-readable business rules. Validation is run to make sure you only get examples that are of high quality. So for example, here is the validation of the Microsoft 10-K. Imagine that same information for (a) all public companies that report to the SEC and (b) reading the information using automated machine-based processes rather than reading the information in a web browser.
Stay tuned for more information. If you want to keep on top of all this, participate in the campaign to improve disclosure quality. By March 31, 2018 the 65 disclosures of the campaign and the disclosures in the Disclosure Best Practices resource should be in sync. Then; I will start adding more disclosures to expand the set available.
Be sure you fiddle with the prototype. There is more there than you might recognize by just glancing at it. This is the primary entry point into the resource. There are about 50 different disclosures. You can see information about each of the some 50 disclosure. You can get information about economic entities that create the reports. Information is linked to US GAAP XBRL Taxonomy information and the Accounting Standards Codification. Topics which will enhance filtering and searching for disclosures will be incorporated. More metadata exists to filter reporting entities by reporting style, by accounting activity, by sector, by size of the company, and other such information is incorporated, but is not apparent yet.
One next step for me is to create this same resource for the XASB reporting scheme. The reason for that is to show that the conceptual model is not specific to US GAAP or even IFRS; it is general. Ultimately, it will work for all of these profiles.
#######################################################
- Here is an older version of this same prototype.
- Here is an older and slightly different version of this that uses topics.
- Here is another older version that leverages the concept arrangement patterns.
- Here is another older version that leverages topics of the ASC.
- Here is another older version that lets you compare the Level 3 Text Block and the Level 4 Disclosure Detail.
Charlie
in Creating Investor Friendly SEC XBRL Filings, Digital Financial Reporting
|
Post a Comment
| Email
| Print
Customizable Tool for Analyzing Text Block Disclosures
I took that disclosure analysis tool and further modified it. Not, it is customizable and you can change the concepts being looked for by simply adding a text block concept to a row in a spreadsheet. Here are three prototypes:
Here is a link to 65 disclosures that I am analyzing during my campaign to improve disclosure quality. I will create some documentation and provide that.
For now, if you go into the column with the stuff that looks like HTML (Column "L") and you double click the cell, a form opens up and the HTML for the Level 3 Disclosure Text Block so you can read the disclosure. The point of the Excel application is to example how public companies are using each text block to see if they are using them consistently.
Charlie
in Becoming an XBRL Master Craftsman, Creating Investor Friendly SEC XBRL Filings, Digital Financial Reporting
|
Post a Comment
| Email
| Print

